Sunday, May 18, 2025

Latest Update on Using USGS River Gauges

 The U.S. Geological Survey real time river gauges have been invaluable to those of us who paddle, row, motor, and fish the streams of the United States.  But they have been going through a lot of changes in the last few years, a few of them good, most of them (in my opinion) not so good.  I've written here before on how to get the most out of them, and in many ways the changes have made getting the most out of them more difficult.  

I had worked out a perfect system for efficient gathering of the information I most needed on the old website.  I had bookmarked, both on my phone and on my laptop and desktop, a page that had a table of all available gauges for the states I was interested in, grouped by river system.  The table listed the gauges, the links to click on for each gauge, and most importantly, the present discharge in cubic feet per second AND the median discharge for the day.  The median is a good approximation of normal.  So I could immediately see what any stream I might be interested in was flowing, and how close it was to normal flow.  Very often that's all I needed to know; if it was near normal and there hadn't been any significant rain in the last few days, I knew the river was floatable or fishable.  And if there had been rain or if the gauge showed levels well above normal, then I could click on the link to that gauge and see exactly what was happening.

So imagine my dismay when one day in 2025 I clicked on that statewide streamflow table page in my favorites, and the page was GONE.  The easiest, simplest, most useful single page in the whole river gauges website, and they dumped it.  There was a place to register comments, and I immediately clicked on it and complained.  I got a nice response back saying basically nothing, and not acknowledging how stupid it was to get rid of that page.  

Instead, there was a map, showing the counties of the state, with little tiny dots to click on for each gauge.  You have to be terrific at geography to know the exact location within a county, or even which county, a given gauge is located.  It was basically guessing, clicking, and seeing if the right gauge came up.  All that info on present flow and median flow was just gone.  One thing the response to my comment did say was that I could put gauges into a "favorites" page.  Otherwise, my only choices were to click dots on that map, or scroll down through the list (which in most states is 200 or more gauges) to find the gauge I wanted.

So, I started exploring that "favorites" idea.  Well, it turned out to be SLIGHTLY more useful.  You could eliminate all the gauges you're NOT interested in within the state.  You could make your list of favorites be grouped by river system and not county, which helped considerably to find them.  You could even click on one button once you get your favorites page up, and have it show the present levels in feet and discharge in cfs for every gauge in your list.  But NO option for it to show the median flow.  For that, you had to go to the individual gauge page and click a few more times.

Since I live in both Missouri and Montana part of the year, and also do some floating and fishing in Arkansas, I needed to set up favorites pages for all three.  Most people probably wouldn't need to do so; their home state is probably all they are usually wanting to bookmark.  And they might not be interested enough in streams on the other side of their state to bother putting them in their favorites list.  For them, the favorites list would be fairly simple to use.  For me...I started out with 85 gauges in my favorites list for Missouri alone.  

So I made a revision on how to use these river gauges, explaining the favorites method.  Meanwhile, the USGS kept tinkering with the gauge pages, and by now some things have changed, and I've made some more decisions on the best ways for me to use the gauge pages, and have discarded the whole "favorites" feature again.  In this article, I had gone through how to set up and use the favorites feature, but then I was going to get rid of all those directions and just go through the simplest ways I've found to use the gauge website. 

However, I realize that my situation is different from what many need.  I'm interested in, and often checking, gauges all over the Ozarks and Montana, and occasionally in other states.  But many people almost never use gauges for more than a few streams close to home that they paddle or fish frequently.  So I went back through the favorites system, which has changed slightly since this article was originally written.  I will start out by showing the steps to take to use the gauges my way, and then show how to set up a favorites system.

Here is how I use the gauges.  Note: I took these images off my smart phone.  The pages may look slightly different on a laptop or desktop computer. 

First, locate the beginning page for the state you want.  For Missouri, it will be "waterdata.usgs.gov/state/Missouri"  

You can start out by doing a Google search for "usgs river gauges (your state)".  When I did this for Missouri, the top search result was "USGS Current Water Data for Missouri".  When you click on it, or enter the link above, you will get this page:


About the only thing useful here is that you can change to a different state easily.  But scroll down, and this map will show up:


This shows the location of all the gauges in the state.  It shows the rivers those gauges are on, but it doesn't name the rivers.  So you must have some geographical knowledge to recognize the river where you're wanting to find a gauge.  This may be the hardest part for many people.  It certainly could have been done differently.  But THIS IS THE PAGE I BOOKMARK ON ALL MY DEVICES, BECAUSE FROM HERE I CAN GET TO THE INDIVIDUAL GAUGE PAGES I WANT. I haven't even bothered to bookmark individual gauge pages, because it's simple enough to get to them from this page.

(Note that the gauge circles are different colors.  The colors denote whether the gauge is "0-5, extremely below"--dark brown, 5-10, much below"--medium brown, "10-25, below"--light tan, "25-75, normal"--light green, "75-90, above"--light blue, 90-95, much above"--medium blue, and "95-100, Extremely above"--dark blue.  The figures denote the percentile of all the flows of record on the date--for instance, a 5 percentile flow means the flows were only lower than that on 5% of the days of record.  You might also see those red exclamation points on some of the circles, which means that the river is flooding at that gauge.  If you scrolled down a bit on this screen, you'd see an explanation of all this.)


You can zoom in on the map by spreading with two fingers on your smart phone to make it easier to see the gauges and click on the gauge you want.  Note that there is an intermittent glitch where when you zoom in, the little circles for the gauges get bigger.  If this happens you can't do anything else, you have to reopen the page.  But if all works right, zooming in on the map should look like this:


Here I've zoomed in on the region that has the Jacks Fork and Current River above the Jacks Fork.  You can see the three gauges on the Jacks Fork.  Say I'm interested in the uppermost gauge.  I click on its little circle.  Here is what happens:

The little circle gets highlighted in orange, the gauge is named below it, and information about the gauge shows up below the name.  This MIGHT be all the information you need.  You can see that this gauge's discharge is 82.7 cubic feet per second, and the little green box saying "normal" means that according to the USGS figures, the river is at a normal level at this gauge.  

If we use the "favorites" system, reaching this point is different, so I'll go through it now.  You can decide whether or not you want to use "favorites".  As you will see, it takes some setting up, and is time consuming if you want to add a lot of gauges to your favorites.  But it might be a better way to go if you only want to monitor a few gauges.

Starting with that opening page showing the map of all the gauges, you scroll down to this screen:

You can see three buttons for "Group monitoring locations by".  If you know the counties the gauges that interest you are in, you can leave the button selected for "County".  If you know the gauges by which river they are on, you'll want to select "HUC-8 basin".  I selected the second option.  Below this screen, as you continue to scroll down the page, you'll see information for every gauge, grouped by the major river.  Let's say I want to add only the fishable streams of the Meramec and Gasconade river systems to my favorites list.  I will scroll down until I reach dark gray headings for the larger streams in those two systems.  Here is the screen for the Meramec River and tributaries heading:

I'm not interested in the two small, minor tributaries shown on this screen, so I keep scrolling down.  Here I've come upon the Huzzah Creek gauge, which I want to add to my favorites.  Note that by clicking on "View 7 day graph", I can reach the actual page for this gauge.  But right now I'm only going to click on "Select for My favorites":
I keep scrolling down, selecting the gauges that interest me of the Meramec and minor tributaries.  Then I come to the heading for the Bourbeuse River, which I know is one of the two major tributaries of the Meramec.  I click on the two gauges on it.  And then the gauges on Big River, the other major tributary, come next.  I continue doing this, finding the Upper Gasconade, Big Piney, and Lower Gasconade.  I end up with 21 gauges selected for my favorites, which I can see by scrolling back up to near the top of the page, where I was before.   Now that screen looks like this--it shows a checkmark and "21 Locations selected".  Right below that is "Show My Favorites options", as well as "View your My Favorites page":


You can click on the options to check the locations you've selected and remove any you don't want.  But if you're sure you've selected the ones you want, you just click on the "View your My Favorites page".  It will look like this:


To insure you get data, I would click on both the button for "Show only data types with data in the last 120 days" and "Show data type period of record details".  Now you can bookmark this page in all your devices.  As you scroll down it, you will come to the first of the gauges you've selected:


 Just above it is a button to click for "Show all latest values".  Note that at this point, the gauges are listed but no other information on the gauges is shown.  But if you click on that "Show all latest values" button, you will see that when you scroll through the gauges below, they will give you the present gauge height in feet and discharge in cubic feet per second: 


If you click on the "View all recent data as separate graphs", you will get graphs for height in feet, discharge in cfs, and any other information being graphed by the gauge.  But you still won't get to the actual gauge page that has ALL the info you want.  So instead you click on the blue "View Monitoring location page" at the top of the gauge heading to get to the actual gauge page.

So to recap, I've given you two ways to set up your river gauge bookmark and select the gauge pages you want to view.  In each one, once you click on the "view monitoring location page" to get all the information you will need, it will take you to this page:

You may want to know the exact location of this gauge if you're not sure you have the right one, so you can scroll down the page to reach a map showing its location:

You can use two fingers to move the map around or zoom it in or out, and thus further locate the gauge or find other gauges.  But now you are ready to get into the meat of the gauge page.  Scroll down from the opening screen to reach the graph showing what the river has done in the last seven days:

This shows that the upper Jacks Fork saw a very slight rise a few days ago, but then continued to drop until yesterday, when it got a slight jump before again dropping.  Note, on the left side of the graph, the increments being measured.  We are talking about fractions of an inch of rise, not feet, so you need to pay attention to the increments being measured.  A real rise will look like the one for upper Big River during this same time period:

Now look at the increments on the left.  The river went from well below 4 feet to well above 10 feet.  To find out exactly how much it rose, there is a slider bar just below the graph.  I have slid the vertical line to the peak of the rise, and at the top of the graph it shows that the river was at 11.42 feet on July 10th at 12;30 PM.  I can now slide the line to what the level was before the rise began:

It shows that the river was at 2.74 feet at that time.  So doing the math, the rise was 8.68 feet.  Then the river began to drop, but had another smaller rise before dropping toward where it is at this time.

You can also see that the river was stable before the rise, and being stable for days like that means it was at normal or low conditions until the rise.

But back to our upper Jacks Fork gauge.  The height in feet is useful for gauging how much a river has risen, but it does nothing to tell you if it is at a normal level, or if there is enough water to float in lower water conditions.  So you don't want the graph for level in feet, you want a graph for the discharge in cubic feet per second.  And for that you have to scroll down until you reach this point:

There is a "graph it" button for "Discharge, cubic feet per second".  Click on it and the screen changes to this:

It shows that the cfs is now graphed.  It also gives you a button to click for "Median day of year statistics--indication of normal levels"!  This is important stuff, so click on it. But before you do, you MIGHT see that button at the bottom for "Temperature, water, degrees Celcius".  Only a small percentage of gauges have temperature readings, but they can be extremely useful for anglers in the colder weather periods.  

Once you click on the median day of year statistics, scroll back up to the graph, and it will now look like this:

Now we are getting somewhere.  The blue line shows what the river has done for the last week, in cubic feet per second.  The gray horizontal lines, one for each day, shows the median flow for that day.  So you can immediately see that the river has been maintaining a flow somewhat above the median, which is, as it said, an indication of normal levels FOR THIS TIME OF YEAR.  Normal levels in the spring are much higher than normals for mid-summer to autumn.  

Below the graph is one of the biggest pieces of information to click on, "Show today's statistics".  Click on the downward pointing arrow, and you get this:

It shows the exact median flow for today (in this case, 45.45 cfs--instead of abbreviating to cfs, they abbreviate to ft^3/s, but it's the same thing).  Please understand that this is the figure at which 50% of the flows ever recorded on this date were higher, and 50% lower.  Remember, it's the best approximation of normal flow for the date.  Then there is the 25th (percentile) at 39.2 cfs (the flow which was exceeded 75% of the time--in other words a very low flow for the date) and the 75th (percentile) flow (the flow only exceeded 25% of the time).  Note that the USGS considers any flow between the 25th and 75th percentile to be in the normal range, which is what the little green "normal" box I pointed out before signifies.  It also shows the "low"--the lowest flow ever recorded on this date--at 22.6 cfs, and the "high", highest flow ever recorded on this date--at 2980 cfs.  Both are interesting but not really useful for our purposes.  It also shows the "mean", at 250.012 cfs.  The mean is the average of all flows recorded on the date, and you might think it would be more useful than it is.  In fact, at least one of the apps thinks it's useful and shows it.  But it is NOT a good indication of normal flows, because it is always skewed upwards by the highest flows being so much higher than normal than the lowest flow are lower than normal.  So in reality it is completely useless and you can ignore it!

When you've gotten to this page, you now have all the information you really need to know almost exactly what the river conditions are.  You've found out whether or not it has had a rise in the last 7 days.  You know how high the rise was if it happened.  You know what it is doing now; steady, dropping, or rising.  You know how many cubic feet per second it is flowing.  You know what the normal flow is for this time of year in cubic feet per second, so you know whether the river is near normal, higher than normal, or lower than normal.  And now all you have to do is remember a few numbers and what they mean.

First, if there has been significant rain, the question will probably be, "is the river too high to float?"  Well, if there has been a rise, how high was it and how long ago was it?  And here are the general guidelines:

If the river was fairly stable before the rise, and the rise was 1 foot or less, you can figure that even at the top of the rise, the river was still close to normal and remained clear, so it should have been just as easily floated as before the rise.  If the rise was 1 to 2 feet, that's enough water that the current becomes much more powerful.  It should still be floatable if you have some paddling experience, and probably not totally muddy, so it should still be fishable.  If the rise is 2-3 feet, it might still be floatable, but only for paddlers experienced in fast, heavy water.  The consequences of mistakes can become severe and even life-threatening, and the inexperienced show avoid floating it.  It will probably be muddy, too, so fishermen will want to avoid it.  If the rise is over 3 feet, simply stay off it!

After a rise on a smaller, clearer stream, it can drop back to near normal in just 2-4 days.  On a larger stream like the middle Current or Meramec, it can take 4-7 days to get back to normal.  Once it drops to within a foot or two of what it was flowing before the rise, it should be in good enough shape to float.

In mid to late summer through fall, the question you want answered is more likely to be "is it too low to float?"  And for that, you only have to remember one very easy to remember number: 100 cubic feet per second.  On any stream in the Ozarks that CAN get too low to float, 100 cfs is the absolute minimum flow for floating without a lot of scraping bottom and possibly dragging your boat through some riffles.  If it's below 100 cfs, expect to have to work at it a bit.  If it's below 75 cfs, you'll do a lot more work.  Under 50 cfs and you'll be walking most riffles.  On the other hand, 150 cfs is getting into the range where you'll be able to float every riffle unless you're poor at reading the water, and 200 cfs is entering the optimal range, where floating becomes easy and you should never scrape bottom.  But 100 cfs is the one number you really need to remember.  

There are other things you can do with the gauges.  You can call up what the flows were at a given point in the past.  Say you floated a stretch of river years before, on a date that you can remember, and you want to know how it looks now compared to what you remember it being back then.  There is a feature on the gauge page where you can go back and look at any time period when the gauge was recording.  I was planning a trip on the John Day River in Oregon a few years ago, on a stretch that I'd been on only twice before--the first time in the 1980s, the second time in the early 1990s.  I couldn't remember the date, except that I DID remember that one of my buddies on the trip had his birthday during it.  So I called him up and asked him what date was his birthday, and thus knew that the trip was around that date in 1992.  The John Day is a somewhat different type of river than Ozark streams, and I knew it could get too low to float in late summer, but I didn't know what kind of flow was the minimum for easy floating on it.  But I could remember how easy it was to float on that 1992 trip, so I called up that week in 1992 on the gauge page for the lower John Day, and saw that it had been flowing around 250-275 cfs then.  So I had a baseline for knowing whether there was going to be enough water for the trip I was planning.  As it turned out, the flow the gauge showed just before we left on the trip was 350 cfs, and the John Day almost never gets heavy rain in the summer; it's a high desert canyon river in central Oregon.  So I knew we were going to have great water conditions for floating it.

I've always said that the USGS river gauges are better than any of the apps you can get, since the apps all use the USGS gauges for their info, and do not offer as much info as the gauge pages themselves do.  But given the number of steps it now takes to access all the information I want in the USGS gauges, the question arises whether the apps are now better or easier options.

So I got several free apps onto my phone, and the answer to that, for me, is still no.  RiverApp is probably the best of them, but the closest it comes to showing the VERY important information on median (normal) flows is a line on the graph showing the yearly average flow at that gauge.  That is NOT good information.  And if you pay for the premium, you get MONTHLY average flows.  Average flows are NOT median flows.  Average flows are skewed upwards by big floods in the past, that are figured into the average.  The average flow will always be significantly higher than the median, which is the flow at which 50% of recorded flows for that day are higher, 50% lower.  It's a far better approximation of normal flow for the date.

Let me give an example.  The upper Jacks Fork in Missouri is a premier float stream that unfortunately is normally too low to float by early June.  A year ago in mid-May when I originally wrote this, the USGS gauge showed the median to be around 220 cfs.  But the RiverApp showed the yearly average to be about 270 cfs.  So, for this particular time of year, there isn't a whole lot of difference between the yearly average per RiverApp, and the median per the USGS.  But...by August, the median flow of the upper Jacks Fork will be around 50 cfs.  And RiverApp will still be showing that yearly average of 270 cfs! 

There are a couple other sites you can go to for river gauge information.  The NOAA river gauge pages have a prediction service that shows what the stream is predicted to do in the next week based upon what it's doing now and predicted rainfall.  It is also easier to see the flood levels. But it leaves out a lot of the information, such as the median flow, that tell you what the river conditions really are.  I might go to it if I really want to get the best idea of what the river might do in the next few days, but otherwise I don't see any advantages to it compared to the USGS pages.

 There is one other bit of often useful information you could still get from the gauge, but I don't know how much longer it will be available. I've been unable to find it on the new pages themselves.  If you scroll back to the top of our gauge page we've been discussing, you'll find a link to "Legacy real time page".  Clicking it will take you back to the format of the old pages after a blurb saying that the page is going to be discontinued at some point.  Scroll down a bit and you'll find this to click on:

See that "Current stage-discharge rating"?  Click on it and it will give you a table that looks like this:

This takes a bit of explanation.  The gauge mechanism measures ONLY height in feet.  That is the raw measurement.  To convert height in feet into discharge in cubic feet per second, actual people have gone to the gauge site at different water levels, and physically measured the flow in cubic feet per second, and they periodically go back and remeasure it.  Thus they come up with a table that matches different heights in feet to the flow in cubic feet per second.  Those three columns on this page show that table.  The column on the left is a given height in feet.  The column on the right is its corresponding discharge in cfs.  The middle column doesn't matter for our purposes.  So if somebody tells you that a month ago the height in feet on the gauge of the river they fished was 2.3 feet, but they didn't check the discharge in cfs, you can go to this table and see what the river is flowing in cfs at a height of 2.3 feet.

In conclusion, I hope this helps you to understand the new gauge format, and how to find the most useful features.  There is a wealth of information in these gauges that most people don't know how to find or use.  They could be made easier and more user friendly, but once you learn to use them, they are better than any of the apps.


Tuesday, October 25, 2022

Learning the new USGS real time river gage pages

 For those of us who depend upon the US Geological Survey river gages, the day has finally come when they are switching over to the new format.  I had explored the new pages a few times, but was holding off on really diving deeply into the information in them, but today when I clicked on a gage, for the first time the new format appeared instead of the old familiar page.  

It is always difficult to switch over from the intimately familiar to something new.  And in playing around with the new format, I had not been impressed.  There was a lot that seemed to be either missing, or more difficult to reach.  But a deeper dive into the information shows that most of what I've used in the past is still available, though some takes a few extra steps to reach.

Most people do not use a tenth of the information these gages contain, anyway.  But in fact, most people don't realize how many ways they can be useful, nor do they understand the main pieces of information--gage height in feet, and flow in cubic feet per second.  I've been on a bit of a crusade for many years to get people to use the flow in cfs, rather than the height in feet, in determining water conditions.  Flow is, quite simply, the volume of water flowing past the gage at any given time.  A reading of 20 cubic feet per second is 20 cubic feet of water flowing past the gage each second.  It is the same volume, no matter which gage you're reading; a reading of 100 cfs on one gage is the same volume of water as 100 cfs on any other gage.  On the other hand, the height in feet is unique to each gage.  A reading of 2.5 feet on a given gage is NOT the same as a reading of 2.5 feet on another gage; on one gage it might signify that the river is very low, on another gage, even on the same river, it might show the river at that point is a couple feet higher than normal.  So unless you already know what 2.5 feet signifies on a given gage, that number will mean nothing.  In other words, the flow in cfs is a universal measurement, but the level in feet is different for each gage.  There actually ARE ways in which the level in feet reading can be useful even when viewing a gage on an unfamiliar river, however.

With that in mind, perhaps we're reading to take a dive into the information contained in the new gage format.  Note that I'm showing the screen shots from visiting the gage on a laptop; the same images open on my phone as well, but in a slightly different proportion--you will have to do a bit more scrolling to reach each part of the page.

When you open a page, this is the information that immediately comes up:

The first thing to note is that you can still reach the old style gage from this page; you'll see a spot to click on "legacy real-time page".  Who knows how long this will still be available, but it's still a possibility right now.

Next, what jumps out is that the graph is for gage height only, unlike the old style gage page that showed graphs for both gage height and flow in cfs.  Keeping in mind my pleading to get used to using the flow and not gage height, this is the first disappointment.  Never fear, you can still get to a graph for flow, it just takes an extra step.

On the other hand, the first thing that is actually easier to do is to change the time span shown on the graph, at least from the default 7 days shown to either 30 days or a year.  You can see the button just above the graph.  While this isn't particularly useful for determining present water conditions, it's a convenient feature for those of us who want to go into more depth on river information.

There is also a convenient feature on the graph itself.  At the top of the graph in orange letters, it shows the exact gage height at the latest time the information was updated.  If using a laptop, running your mouse across the graph moves a dashed vertical line across the graph, with a black dot where the line intersects the orange height reading line.  The readout at the top of the graph changes to show what the exact height reading was at that point.  So you can run back to any given point on the graph (any point in the last seven days in the default setting) and see what the exact river level was.  Here, I have moved the vertical line back to around the beginning of Oct 23, and you can see that at 11:45 PM on Oct 22, the river was at 1.34 ft.
You can use your finger to do the same thing on your phone if it's like my Iphone.


There is also another way to zoom in on the graph to show shorter time periods.  There is a bar with handles just below the graph.  Using those handles, you can move in to show any time period within the default 7 day graph.  Here, I've dragged the left handle to the beginning of Oct 23, and the main graph has zoomed into just the time period in gray on the handles bar.
However, on my phone, this bar with handles does not show up.

A few other things to note on this top portion of the page shown...the level considered minor, moderate, and major flood stage is interesting.  And the button to click to "compare to last year" is also a fun piece of info to see.  Neither is very useful for determining how floatable or fishable the river is now, though.  There is also a button to "display median", but it is inoperable when the graph for height in feet is displayed.

So, scrolling down the page to the lower portion, we see this:
Aha!  Now we have a button to click on to change the graph from height in feet to "Discharge, cubic feet per second".  So one click will change the graph to what I really want to see.  It will also make the "display median" button operable.  So, clicking on the discharge button and the median button, we get this graph:
The graph is now for flow in cubic feet per second, and the median is shown as a dotted line going across the graph.  Median is a VERY important piece of information.  It is a good approximation of the normal flow for the time period, so we can see in this case that the flow was a bit above normal, even before the rain a few hours ago raised the river slightly.

On the old page, there was a table that showed the exact median flow for the present day, but alas, that table is missing on the new pages.  You can still get that information as well, it just takes more time and clicks.

Another feature is that you can click on the button "Select data to graph on second y-axis", and then a couple other buttons will appear.  You can click on the "gage height, feet" button, and get the gage height onto the same main graph.  The other button on this particular gage is "precipitation, total, inches".  Not all gages will show precipitation.

The next option down the page is "Today's statistical data".  Clicking on it gets you that table I mentioned above showing the median and other info on the old gage pages. That info includes the latest value of streamflow, the lowest ever recorded on this date, the 25th percentile, median, 75th percentile, mean, and highest value ever recorded on this date.  Here is the table:
Of this information, median is the most immediately important.  Median, as I said before, is a good approximation of what the river normally flows on this date or time of year.  It is the flow of which 50% of all recorded flows for the date are lower, and 50% higher.  The 25th percentile value is the flow number for which only 25% of the recorded flows were lower, and the 75th percentile is the flow number for which 75% of recorded flows were lower.  The mean is the average of all flows recorded for the date.  You might think it would be a better approximation of normal than the median, but it is not, because any really high water recorded on the date skews the average upward; the mean is always a significantly higher figure than the median.  The lowest value and highest value show the lowest and highest flows ever recorded for the date, and the year in which they were recorded.

The next menu is the "Hydrograph data table(s)".  Clicking on it gives you all flow figures downloaded from the gage and the times they were sent.  It is not particularly useful for recreational purposes, so you can just ignore it.

Below that is a map showing the exact location of the gage, and the extent of the watershed feeding the stream down to the gage.  It also shows other active gages (monitoring locations) on the stream and surroundings.  This can be very important info on an unfamiliar gage.  In this case, knowing that the gage is downstream for such sources of flow as Maramec Spring, Dry Fork, and the entire headwaters area of the river, but upstream of the mouth of Huzzah Creek, tells you that the gage is most useful for the stretch of river between Maramec Spring and the Huzzah.  

The next menu is "Summary of all available data".  Clicking on it doesn't give the recreationalist much good info in itself, but it brings up another link to click on, "Water Data for the Nation Inventory".  This gets you into some real meat as far as river gage info goes.  It brings up a different page that looks like this:
Clicking on "Current/Historical Observations" just takes you back to the new gage page.  "Daily Data" actually takes you to something resembling the OLD gage page, but with the default of showing the gage height and flow rate graphs for the last year.  You can change the dates and time periods shown if you wish.  The graphs:  
There is one more piece of info that I find useful to get from this page. Near the top of the page is a link to "Current stage-discharge rating".  Clicking on it, you get this:
It may look like gobbledegook, but scroll down past the first part to the three columns of numbers, which will continue farther down the page than shown here.  These numbers will take just a bit of explanation...

River gages actually measure the water height.  Basically, a gage is a vertical tube, with the bottom down in the river water, and the top way up above normal river level.  There is a float inside the tube that goes up and down as the river level comes up or down within the tube.  Gage height readings come from that float.  Periodically, USGS personnel visit the gage and measure actual flow in cfs, and also measure the profile of a cross section of the river valley at the gage.  Then they estimate the flow rate in cfs at every given water height, and make up a table of these values.  So when you see the flow in cfs graph and numbers, these are actually the estimated flows in cfs for the given, recorded gage height.  Since the profile of the river bottom and banks can change with each high water, these values will also change; a gage height of 2 feet might not mean the same flow in cfs after a flood as it did before the flood if the flood changed the banks or bottom of the river at the gage.  That's why the personnel periodically check the accuracy of the tables they have.  

So the columns of numbers on the page we are now discussing are the height and corresponding estimated flow in cfs.  The gage height numbers are in the left hand column, the corresponding flow rate numbers are in the right column (the middle column is not important to our purposes).  The numbers start with the lowest possible height reading (basically the bottom of the gage tube), and go to the highest possible reading at the top of the gage tube.  Note that most gages have their bottoms well under the lowest level the river has ever dropped to, so the numbers at the top of the columns are so low that they will probably never actually be seen in a gage reading.  If we scroll down the page a bit, we will get into more realistic numbers:
So you can see here that, for instance, a gage height of 2.30 feet (from the column on the left) means the river is flowing an estimated 644.24 cubic feet per second (from the column on the right).

This may be diving farther into the weeds than most users will ever need, but if you really want to go in-depth on river information it can be useful.

The next menu is "Daily Statistics".  It is another one that can be useful if you want to go deeply into the information available for the rivers.  Clicking on it brings up this page:
It shows the available data being the discharge in cfs for the time period from, in this case, 1922-10-01 to 2022-08-17.  Click on the box on that, and then down below, you can make choices on the date range of the data you want to see, and a drop down menu of which table you want to see.  The default is "mean", but if you click on the menu it will give you the choices of minimum, maximum, and a bunch of percentiles including "median".  We already know that median is far more useful than mean or any of the percentiles.  Minimum and maximum will give you the highest and lowest values ever recorded for each day of the time period you select.  But, let's select a time period beginning with the earliest data and ending in the latest available, from Oct 01 1922 to Aug 17 2022, and then select median from the drop down menu.  Hit "submit", and it gets us this:
  This is a table of the average median value for every day of the year throughout all the years of record available.  In other words, this is a table of what normal flow for the river at the gage site should be on every given day.  So if you want to know what the river should normally be flowing on, for instance, March 15th, 555 cubic feet per second is your answer.  More interestingly, you can look at this table and see that the river normally flows more water at certain times of the year than others.  In April and into May, it normally flows the highest, 500 to well over 600 cfs.  While in September and October it will normally flow less than 200 cfs.

The next menu is "Monthly statistics".  Clicking on it gives you similar choices but by month instead of day, and only for mean values.  For our purposes it isn't very useful, for it can be fun to play around with.  "Annual Statistics" is similar.  You can pull up the annual mean for each year of record, which can show you which years were drought years and which were more normal or high water years, but it isn't useful for recreational purposes.

"Peak Streamflow" simply gives you the highest flow recorded for every year.  It is also interesting but not useful for recreation.  The rest of the choices are useless for our purposes.

So there you have it, a summary of the data contained in the new USGS river gage pages, and how to access it.  If you are a floater, an angler, or anyone wanting to find out about water conditions on a given stream, the new pages are very useful but take a bit of getting used to.  Here is how I typically use them:

First, go to the USGS river flows data for the state you're interested in.  Here is the page for Missouri:

 
https://waterdata.usgs.gov/mo/nwis/rt

On that page, you will see a link to "Statewide Streamflow Table".  Click on it, and you get this page:

https://waterdata.usgs.gov/mo/nwis/current/?type=flow

It will look like this:
Note that over on the left are links to click on for every gage in the state.  On the right are figures for "Discharge, ft3/s" (that's what the stream at each gage is flowing presently) and "Long-term median flow (present date)" (that's the median or normal flow for the date).  So immediately, you can see what the river is flowing now and compare it to normal.  Much of the time, that's all you need to know.  For instance, scrolling down the page, which is grouped by major river systems, to the Meramec River system, we get this:
Say I'm wanting to know what conditions are on Big River near Richwoods, because I'm wanting to fish the lower middle river.  I can instantly see that the normal flow there is 164 cfs, and it's flowing 190 cfs right now.  That's plenty close enough to normal; the river should be in good shape.  If weather conditions were stable and there hadn't been any rain in the last day or so, that would be good enough, no need to actually even visit the gage page.  I have this page, the streamflow table, bookmarked on all my computers and my phone.  All I have to do is click on it, and scroll down to the river I'm interested in, and see if it's near normal or not.

But...it HAS rained in the last day, pretty heavily.  So is there maybe a slug of higher, muddy water moving down the river that just hasn't reached the Richwoods gage yet?  So I look at the upstream gages on Big River (fortunately there are several; some streams have only one or two gages on them).  I note that at Irondale, the highest gage, normal is 23.0 cfs and present flow is 55.8 cfs.  That's a bit of a rise, but not much.  If the river had risen several feet it would be flowing a lot more water than that.  No problem there.  At the next downstream gage, below Desloge, it's only flowing 98 cfs.  No big rise there.  Below Bonne Terre shows a more significant rise; normal is 60.0 cfs, it's now flowing at 265 cfs.  Okay, better go to that gage page and look a little more closely.  Here is the graph that comes up on the new gage page:
Now, here is where the height in feet graph does come in handy.  It's showing the river has risen from about 2.75 feet to 4 feet, and may still be rising.  That's a rise of over a foot.  A good rule of thumb is that a rise of more than a foot is fairly likely to mean a slug of muddy water.  So now my fishing trip downstream from there is looking a little more iffy.  Maybe I better either go now and hope I can get in some good fishing before the muddy water hits, or else look for a different place to go that isn't quite so chancy.

What if this was a few days ago, when the Missouri Ozarks had been in drought conditions quite a while, and all the rivers were low?  What if I wanted to float the Jacks Fork, and wondered if there was enough water to float from Bay Creek to Alley Spring? I would have gone to the statewide streamflow table that I had bookmarked, and looked at what the gage info said.  But...what if I was totally unfamiliar with the Jacks Fork, and didn't know which of the three gages on it to use, nor what flow would constitute enough water to float?  Well, then I would have to go to each individual gage page, and fist look at the map we discussed above to see exactly where the gage was.  It would show the "near Mountain View" gage to be farthest upstream, at the Highway 17 bridge.  Zooming in on the "at Alley Spring" gage would show it was at the Highway 106 bridge.  And most importantly, just UPSTREAM from Alley Spring itself, which we might know is a large spring that adds a considerable amount of water to the river.  So if we are floating down to the bridge at Alley, that gage is PERFECT for determining water conditions on that float.  So was there enough water?  A few days ago the gage was showing around 60 cfs.  And here is where a big rule of thumb for Ozark streams comes in.  To float any Ozark stream that can get too low to float, you need a minimum of 100 cfs to get down it without a lot of scraping bottom and maybe some walking shallow areas.  Knowing that easy to remember number, I would now know that the float down to Alley was going to be some work dragging a canoe or kayak here and there.  (Right now, as I type this, the Alley gage is showing 74 cfs--it's had a slight rise, but is STILL too low to float easily above there.)

What if I wanted to know whether the river BELOW Alley Spring ever gets too low to float?  I would go to the "at Eminence" gage page, which I know is downstream from Alley Spring. Then I'd go through the steps on the new page to reach that table that showed the median daily value for each day of the year, which I discussed at length above.  It would show this: 
You can see that there is no day of the year in which the median was under 100 cfs.  So normally, that stretch would not get too low to float easily.  If I still wondered if it could get too low during a really bad drought, I might change the drop down menu from "median" to "minimum".  This would give me this table:
See all those values below 100 cfs?  So it IS possible for the lower Jacks Fork to get too low for easy floating, but only if there has been a VERY extended drought.

You can use your imagination to see how many things you can learn about the rivers from the gages.  Knowing how to use them can save you a lot of drive time and phone calls and disappointments.  The new gage pages are good in some ways, not so good in others.  But they will serve the purpose well.  

The following are some of my own rules of thumb for determining water conditions from the gage numbers:

1.  The minimum flow for a stream being floatable without a lot of dragging and scraping--100 cfs.  I have floated plenty of streams at lower flows than this.  Even at about 30 cfs, narrow riffles may still be floatable.  But at anything lower than 100 cfs, wide riffles and split channels will often necessitate walking, and riffles with rocks and a lack of well-defined lines to run will be problematical.
2.  The optimum flow for most streams that are sometimes not floatable is 200-300 cfs.  At that flow nearly all riffles will be easily floatable, but the water won't be so high that the dangers are magnified.
3.  For those running jetboats, the approximate minimum flow for running an unfamiliar river is 500 cfs.  I've run stream sections at less than 200 cfs, but they are streams I know well.
4.  As for whether a stream is too high for safe floating, that is where I do use the graph for gage height.  First go back to the last time the river was stable, as in several days with little change in the level in feet or the flow in cfs.  Note the level during that time.  Then check how much higher than that the river is now.  If it's less than a foot higher, it should be good, not muddy and not really high.  If it's between one and two feet higher, it may be muddy and more caution should be used, because it will be moving fast and obstructions could be seriously dangerous.  Between two and three feet higher, it's going to be pushing the envelope for floating, and you should stay off it unless you have plenty of experience in big, fast moving water.  Over three feet higher, and it's getting truly dangerous.


Tuesday, April 5, 2022

Crazy Big Fish

 This is an old piece of writing from 2011.  That was a year of the periodic cicada emergence in Missouri, and we had a lot of them around the house.  The fish in the story, by the way, was STILL alive in my pond as of the fall of 2021.  

After supper this evening, I decided to take my lightest intact fly rod out to the pond beside the house to catch some small bass and bluegill to replenish my fish supply in the freezer. There are a lot of bass in the pond, probably too many, so I like to keep a couple dozen 10-12 inchers throughout the year, along with a bunch of bluegill. The bluegill are fairly big, 9-10 inches. The pond is somewhere between a half-acre and three-fourths of an acre in size, and 7-8 feet deep at the deepest.

The cicadas were on the water regularly and getting eaten just as regularly, but I decided to see if they'd take an ordinary white popping bug with black feathers. They did. Mary came out and caught five from one corner where the bluegill bed, but then decided it was too hot and headed for the house. I took a couple more from there, then worked my way around the pond, picking up a few bass. There is a shallow point where the bluegill also bed, and when I got to it I caught a couple more. I could see something moving just below the surface a little farther out on the point, and figuring it was a bass cruising for cicadas, I made a bit longer cast to reach it. The bug landed and the water bulged and moved a bit a couple feet away. Aha, I thought, the fish is moving toward the bug...

There was just a tiny "something" that happened at the bug, and it disappeared.

I set the hook, and instantly the water bulged in a boil the size of a bathtub. A bass? I knew there were a few bass in the pond that would go 6 pounds or better. The fish moved off the point toward deeper water, shaking its head. I could feel each shake...and they were really BIG shakes. Not quivers or jiggles or jerks, but hard, sharp, huge surges. This wasn't a bass, or if it was it was a record.

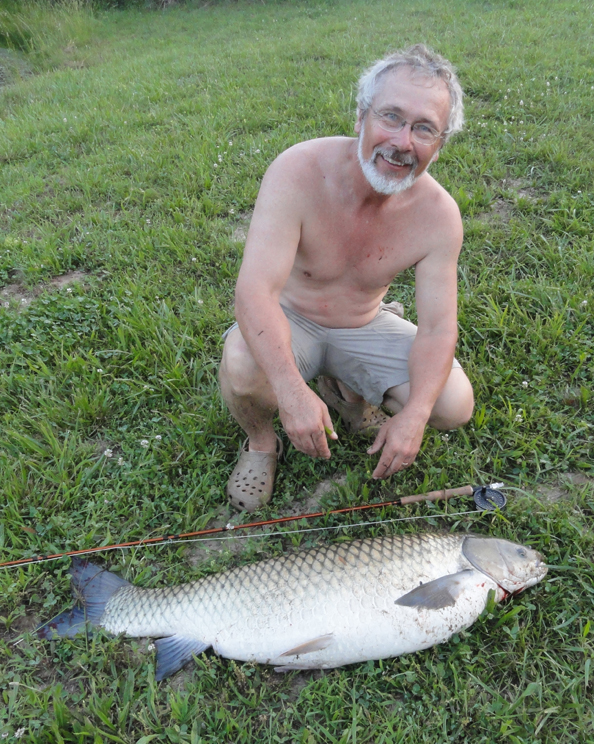
And then it dawned on me. At least ten years ago, I had put three small grass carp in the pond to control algae. I never saw more than two of them after that, but the two got bigger and bigger. They were shy and wary and really the only way I ever got any kind of look at them was if I climbed up on an observation deck we have on the roof of the house and watched carefully. I've plotted for years how to catch them, because I knew they were getting pretty big. The last couple years I've only seen one at a time, and I suspect that one is all that is left.

I had hooked that grass carp!

It took a good 45 minutes to land it on a 6 weight fly rod, which begs the question of whether I could have handled it at all on the 4 weight I usually use to catch bluegill. It ran all over the pond. I mainly held on, giving it line whenever it moved, slowly pulling it back toward me when it rested. A couple runs were truly epic, halfway across the pond in a second or two, but mostly it just swam around shaking its head and when I'd get it fairly close it would lunge out to the middle again. I really wanted to land it just to really see how big it was. It was hot, and I was truly getting tired. I wanted Mary to see this beast. I wanted a photo of it.

Finally I got it coming toward me for about the umpteenth time, and slid its head up onto the bank by backing up a few feet and pulling as hard as I dared. Then I ran down to it and grabbed it by the gill covers with both hands and dragged it up the bank. I left it a few feet from the water while I ran to the house to get Mary and a camera. She was flabbergasted to see this scaly monster. Here it is in all its glory:post-218-13071514792391_thumb.jpg

I decided to release it, and it took several minutes of moving it back and forth in the water to revive it enough for it to slowly swim away. I hope the old cow makes it.

It was getting dark and I suddenly realized I had a bunch of fish to clean. I looked down at the bank where I'd left my rope stringer full of fish, holding it down with my foot while I fished...I'd totally forgotten about it, and the fish had swum off with my stringer long ago, I guess.

The Great Australia-New Zealand Adventure

This was a trip Mary and I made in 2015.  The write-up was done for OzarkAnglers forums.  It's one of a number of old stories I'll be putting on here in the next few weeks.


 It almost makes my head hurt trying to figure out times and dates when you fly to Australia. We just got home a couple hours ago, about 6 PM on April 9th...but the plane took off from New Zealand at 7 AM on April 9th. But we were in the air 4 hours from Christchurch NZ to Brisbane AU, then two hours in the Brisbane airport, then nearly 13 hours over the Pacific from Brisbane to Los Angeles, then 1.5 hours (barely made it through customs and immigration in time) at LA, then 5 hours from LA to Minneapolis, an hour in Minneapolis, then 1.5 hours to St. Louis. By my math, including the nearly 2 hours in the Christchurch airport, we were either in airports on in the air for a total of 30 hours.

Fortunately, both going over there and returning, we had accumulated enough frequent flier miles previously to be able to afford business class tickets. And I gotta tell you, if you're planning a long flight like that, you need to do business class if you can swing it. I saw how the peon class was on the flight. The seats on the Virgin Australia plane had SOME legroom, unlike the seats on the Air New Zealand flight we had getting from Brisbane to Christchurch earlier in the trip. But meanwhile, up in business class we had seats that were fully adjustable from fully upright to fully reclining like a bed and everything in between, we got food that was really about as close to gourmet as you can get on a plane, all the booze and soft drinks we could consume either at our seats or at a real bar with four barstools, a set of soft comfy pajamas, an overnight kit with toothbrush and toothpaste among other stuff. We had free movies and TV right at our seats on a good sized screen that swung out in front of each seat, along with chargers for cell phones and Ipads. And enough space in the two aisles to walk around all you wanted to without waiting for some fat boy to get past you. Both flying there and back, the stewards or whatever they are called these days dug out foam mattress pads and sheets after feeding us a big meal and seat up the seats as pretty darned comfortable beds, and then turned off the lights. It was a bit weird, given that we left Australia about 11 AM and were in bed within three hours or so of taking off, but we were running into the sunset and it was dark outside within an hour of lights out, and we got out of bed two hours before landing, at 4 AM LA time.

So the flights, instead of being a true ordeal, were actually about as much fun as I've had on a plane in a LONG time. As for the trip itself, here's what we did in a nutshell:

March 7th--left home early-early in the morning to catch a flight to, of all places, Atlanta, in order to get a connecting flight to LA. Arrived about 7 AM March 9th (yep, that makes my head hurt, too) at Brisbane (it's pronounced BRIS-bn by Australians), and immediately caught another flight to Melbourne (MEL-bn), where we met our Australian friends Krystii and Michael. Krystii is also an artist--we met them at an art show 15 years ago), and up until they immigrated to America 5 years ago Michael was the head of technology and heraldry at the Australian National War Museum. They were to be our guides and drivers while in Australia, and then just fellow travelers with us in New Zealand for the trip. Since they drive on the wrong side of the road in Australia and NZ, neither Mary or I wanted to have to drive if they were willing to do so. We rented an SUV and drove through Melbourne, then out an hour or two to Healesville, where we stayed the night at a couple of beautiful cottages in the Toolangirainforest.

March 10th--we liked the cottages so much we stayed there another three nights instead of going on to the next place, which was a couple hours away, for two nights. We hiked in the Toolangi much of the day this day.

March 11th--did another hike and some sightseeing, including visiting the area nearby where Krystii and Michael had lived for several years.

March 12th--more sightseeing and a visit to a wildlife park in Healesville, where we saw all kinds of indigenous Australian wildlife. Our friends had assured us that we'd see a lot of kangaroos on this trip, but other than at the zoo we only saw a half dozen roos at long distances. We did see quite a few wallabies, the smaller kangaroo critters, while hiking. The rainforest was magnificent, with mountain ash trees that were getting up to the size of the largest Douglas firs in North America. These were the biggest non-conifer trees in the world, and like most of the native Australian trees, were a eucaliptus species. Just as impressive, and making the forest look like something in which you'd expect to encounter velociraptors, were the giant tree ferns, some of them 20 feet tall. Mary, however, probably didn't enjoy the hiking as much as I did, because she'd read far too much and been told far too many stories about the myriad of snakes and spiders in Australia that can kill you very quickly. We never saw a snake outside of a zoo, nor any dangerous spiders, but Mary couldn't quite relax as much as I did while hiking.

March 13th--we drove to the small town of Corowa, taking the scenic routes and sightseeing. Michael was giving a talk at a gathering of military vehicle enthusiasts there that night, and the town was packed with authentic WWII vehicles and guys driving them around. We stayed at a modest but nice motel.

March 14th--We watched a big parade of the vehicles, then dropped Michael off at an extensive swap meet for vehicle parts and other wartime memorabilia while the rest of us walked all over the town and did a hike along the Murray River. K and M knew I loved to fish, and I think they expected me to fish the Murray for a while, but it was a big, slow river that didn't lend itself to fishing from the bank, and I had no clue how to fish for Murray cod, the predominant species in the river, anyway. We stayed the night hosted by friends of K and M in the not too far away town of Wangaratta.

March 15th--we did a long drive over the highest mountains in Australia (6000 feet elevation maximum, which gives you an idea that Australia isn't real mountainous) through Mt. Kosciusko National Park to Jindabyne. While the mountains may not have been all that high, they were spectacular, and the road was non-stop hairpin curves. It was extremely rugged country, with incredibly thick forests on the slopes and high alpine scenery near the tops of the mountains. After picking up groceries in Jindabyne, we drove a few miles out of town to the Moonbah River Huts to spend the night. The huts looked really good on the website, but were quite...rustic in reality. We'd always looked for places with separate bedrooms for the two couples and separate bathrooms as well. The hut we stayed in had a bed in the living room, one bedroom, and one bath (well, it was two rooms, with a sink and tub in one and a toilet in the other). It also had a barely working microwave and the stove was an antique wood-burning job. Mary had planned to make her famous dinner rolls, and it was a real adventure figuring out how to bake them in a wood oven.

March 16th--the reason we'd picked the Moonbah Huts to stay was mainly because they were on the Moonbah River, which was reputed to have good trout fishing. The river turned out to be a creek about 10-15 feet wide and completely closed in with very thick brush. It was fast and clear and the bottom consisted of very rough rock. After doing a hike in the morning back in the National Park, I bought a month's fishing license at Jindabyne ($14 Australian) and tried to fish it in the afternoon. It had quite a few little brown trout, which I caught on elk hair caddis (yep, they have caddis flies in Australia, though I never saw more than one or two in the air at once).

March 17th--after another night in the hut, we did another hike in the park during the morning. This forest was a little drier than the rainforest earlier, with smaller trees and brush not so thick. We hiked to a high waterfall and back. Then, while the other three did another short hike for a couple hours, I fished another stream, a little bigger than the Moonbah, that was coming out of the mountains, and finished achieving my Australian trout slam with a rainbow and a couple of little brook trout.

March 18th--after the third night at the hut, we drove to a high point in the park, with alpine scenery and beautiful alpine gums, another eucalipt. Then started the long drive to the Australian capital of Canberra (CAN-bru), where we stayed the night in separate one bedroom furnished apartments that were pure heaven after the Moonbah Hut.

March 19th--the plan for this day was for Michael to take us on a behind the scenes tour of his former place of employment, the War Museum, for a couple of hours, and then tour some of the other sights of the city. Well, the War Museum is, if not THE best, at least one of the very top museums of its kind we've ever seen, and we spent the whole day there. Not only that, but we also spent a good part of the next two days there as well. It covered, in depth, Australia's involvement in every war from WWI on, and if you didn't know it, until Grenada Australia had participated in every war of the 20th Century that America was involved in (and Iraq and Afghanistan too). There were vast amounts of artifacts and vast amounts of memorabilia and explanations of every aspect of every war. Dioramas galore, beautiful artwork, multimedia productions that were extremely well done. I still don't think we saw it all.

March 20th--we spent much of the day at the War Museum, and ate dinner with friends of K and M that night.

March 21st--well, at least we visited some of the other places of this beautiful city. Canberra was a planned city; it was mainly built in the 1950s specifically to serve as the capital city, and the government buildings and settings around them are quite impressive. We visited the National Museum of Art and the National Portrait Gallery, both of which had some very good art and some very bad art. We had dinner with two more friends of M and K, and spent our last night in the very nice furnished apartments.

March 22nd--we flew from Canberra to Brisbane. The Canberra airport, for a capital city airport, was small and uncrowded, and going through security there was a breeze, vastly unlike what it is at any airport around Washington DC. The two hour flight put us in Brisbane in mid-morning, and we lunched with another friend of Michael's, a former brigadier general in the Australian army who has retired to an ocean-front home where he is a gourmet cook. Krystii's mother lives in Peregian Springs, on the Sunshine Coast north of Brisbane, and after lunch, we drove the new rental SUV the 1.5 hours to her house, where M and K would be staying for the next few days while Mary and I stayed at a furnished apartment on Sunrise Beach a half hour away.

March 23nd--Mary and I enjoyed the Sunrise Beach. It is a spectacularly beautiful beach, and was nearly deserted while we were there, due to the fact that summer was over (barely). The water was a pleasant 75 degrees. I finally figured out how to convert Centigrade to Farenheit, since they only use C in Australia and NZ. 0 degrees C is 32 degrees F, and from there, for every five degrees it goes up in C, it goes up 9 degrees in F. So 5=41, 10=50, 15=59, 20=68, 25=77, 30=86, 35=95. Air temps never got above 30 C in Australia while we were there, but the beach area was very humid. The water was nice, and the waves were just big enough to be fun to play in and try boogie-boarding.

March 24th--Mary and I established a routine of walking two miles up the beach each morning to the nearest town area, where we found a nice place to eat breakfast with free WiFi so we could check emails and play on the internet for a while. Then we'd come back down the beach, and by that time it would be warm enough for a swim to be nice. In the afternoons we'd explore the area with K and M and M's mom.

March 25th--on this day we found a huge colony of fruit bats (flying foxes) right in a nearby town. There were thousands of these bats the size of rabbits. They were just hanging from the tree branches in huge clusters, fanning themselves with their leathery wings, climbing from one spot a better one occasionally. In the evening we watched them fly out of the trees in numbers darkening the sunset skies, branching off to go in three different directions (just not out over the ocean).

March 26th--highlight of this afternoon was a pontoon boat trip up the Noosa River, where I tried my luck at fishing, catching a bunch of little catfish that looked very much like small blue cats.

March 27th--after a final night at the beach apartment, we drove to Brisbane to catch the flight to New Zealand. We arrived in Christchurch very late, near midnight, and spent the night in a motel close to the airport.

March 28th--We drove through the city center of Christchurch, which had been all but destroyed by a huge earthquake just a few years ago. Construction was everywhere, as were crumbled and damaged buildings. Then we headed off to the west across the Canterbury Plain from Christchurch on the South Island, over Arthur's Pass in the Western Alps. On the east side of the mountains it was dry and warm and sunny, with scrubby vegetation, but by the time we reached the pass we were in fog and rain. We stopped at the town of Arthur's Pass to pick up info on the national park there, and Mary and I hiked an hour or so in the rain to a magnificent little waterfall. Then we drove down the west slope in rainforest to the narrow coastal plain on the west coast, and down it to the tiny town of Okarito, where we had a house rented for the next two nights. The house wasn't much, but the little settlement was quaint.

March 29th--we spent the day driving to the Franz Josef and Fox glaciers. These are the only glaciers on earth that drop straight off mountains into rainforest, and they are spectacular. We hiked up as close to the glaciers as we could get--it gets dangerous to get too close since they are continually dropping huge chunks of ice. Then we hiked through the rainforest below and across a suspension bridge over the wide, brawling, silty glacial river below the ice.

March 30th--we kayaked the Okarito Lagoon in the morning, a tidal lagoon full of various wading birds and waterfowl, not all that impressive though. Then we headed back across the mountains through awe-inspiring scenery, headed for the town of Wanaka and another slice of heaven after the disappointment of Okarito, a fine furnished apartment in the middle of Wanaka.

March 31st--I'm not sure what everybody else did the next two days, because they were my New Zealand fishing days. I'd hired a guide (expensive--over $500 a day in U.S. dollars), and on this day we drift fished the Makaroa River above Lake Wanaka. This was a smallish river, barely floatable in the low water of early autumn, flowing through a vast bed of glacial gravel and surrounded by mountain scenery. It was extremely clear, and to be honest, it probably had fewer fish per mile than any river I'd every fished for trout. After all, you could see just about every fish there was, and in five miles of river I doubt that we saw more than a couple dozen fish. But they were all big...and wary. This was technical fishing, where you absolutely couldn't make a mistake and catch a fish. If you lined them they were gone. A bad drift and they were gone. A fly that slapped the water a bit too hard and...well, you get the picture. Montana fishing is combat angling in comparison. I got several to take dry flies, and finally landed one big rainbow, a good 22 inch fish.

April 1st--on this day we fished the Clutha River, and it was very different. Big water, as big as the White River when they have a lot of generators working. Fast, clear...and a lot more fish but most were a lot smaller. I caught a bunch of fish on dry flies and a few on streamers, but only a couple were worthy of pictures. And some of the biggest ones were lying along the banks in shallow water, 1-2 feet, often under overhanging willows. It took accurate casts and good drifts to get them to take, and although I got several big ones on, it was one of those days when I couldn't keep them on. Still, it was a great change of pace after the previous day.

April 2nd--with one more full day in Wanaka, I had the option of fishing on my own for the day, but instead we hiked up a mountain overlooking Lake Wanaka, and spent the rest of the day roaming around the very nice town and walking along the huge lake.

April 3rd--we left Wanaka, headed first for Queenstown, where we had plans to do ziplining down a mountain overlooking the town. Mary and I also thought about mountain biking down the same mountain, and were about to rent the bikes when we were convinced by the livery people that it was probably not something we would want to do. The mountain was about 3000 feet high and scary steep, and the biking consisted of taking hairpin curves at speed on a trail no wider than you are, jumping boulders, etc. And we weren't especially interested in the ziplining, so while M and K ziplined, Mary and I had a nice, long, strenuous hike on the other side of the mountain, one of the best hikes of our whole trip and away from the hordes of people roaming around the touristy area at the top of the gondola ride from where the ziplines and luge rides and mountain biking started, and where our hike started as well. Then we drove on to Manapouri, a tiny town on the huge lake of the same name, nestled in the mountains. The house we had rented there was plain but clean, and was just an overnight stop.

April 4th--at noon, we toddled down to the lake and got on a big cruise boat for the 45 minute ride to the other end of the lake, where we got on a bus for an hour's ride on a piece of road that only connects the lake to Doubtful Sound, with no other connections. The NZ government had constructed the road to service a set of tunnels they built from the higher elevation lake to the Tasman Sea, with turbines to generate electricity. It was quite a scheme, and it made possible our cruise. When we reached Doubtful Sound, a huge fiord with several arms running into the sea, we got on a bigger cruise boat for an overnight cruise on the sound. This was perhaps the most spectacular place I've ever seen. The mountains rose straight out of the sound, often near vertically, for thousands of feet. Waterfalls pouring out of the high hanging glacial valleys were everywhere in towering thin ribbons dropping hundreds, even over a thousand feet. There were seals and sea lions out near the mouth, and dolphins back in the sound, and sea birds everywhere, but mainly it was just staring at the scenery with your jaw dropped.

April 5th--the room on the boat was small but very nice, with private bathroom. The evening meal and breakfast in the morning were excellent. The day before had been cloudy and rainy with clouds hanging on the sides of the mountains, but this day was sunny and the experience was totally different and no less spectacular. We spent the morning cruising parts of the sound we hadn't seen the previous day, and ended the cruise late in the morning, taking the bus back up the twisting gravel road and over the pass and down to Lake Manipouri, where we got back on the boat to take us across the lake to the car. From there, we drove out of the mountains and across rolling, hilly countryside covered in sheep, to Dunedin on the west coast and the cottage on the Otago Peninsula, which turned out to rival the Moonbah Hut in it's shabbiness. The beds were horrible, the carpet looked like it had experienced about 500 cats in the last 20 years, and the kitchen was none too clean.

April 6th--the reason we had picked the cottage was because it was close to the end of the peninsula, where there was the only mainland colony of royal albatrosses and blue penguins. We did the albatross tour, seeing a bunch of fuzzy young not yet fledged and a couple of adults flying around, and just before dark we did the penguin tour, which consisted of going down to a small patch of beach and watching these tiny penguins the size of frying chickens coming out of the sea and waddling accross the sand and rocks and up into their nighttime burrows in the grass. It was pretty cool.

April 7th--we explored the peninsula, including a nice hike in native forest and down to two other beautiful beaches. We stayed at the second beach late enough to see a few yellow-eyed penguins coming onto shore, and then headed back to the tiny town on the peninsula where the cottage was, and where we had a great meal in a nice restaurant.

April 8th--we said a not so fond farewell to the grubby cottage and started the five hour drive back up the coast to Christchurch, stopping only to take in the Moeraki Boulders, a tourist trap along the highway but still the boulders themselves were interesting, almost perfectly round, smooth rocks up to five or six feet across that dotted the sandy beach, with a few emerging out of the higher bank behind.

April 9th--after spending the night at the same Christchurch motel we'd stayed at the beginning, we got up at 4 AM to catch the flight from Christchurch, the first leg of our journey back home.

Some random notes...

Australia is really big on round-abouts (traffic circles) and they really really work well when all the drivers know how they work. Traffic circles seem to be hard for American drivers to figure out.

Australia is also really big on speed limits, and there are traffic cameras everywhere. And you get a ticket if you go one kilometer over the limit, no exceptions, and points off your license big time.

Also, they are hard of drinking and driving. Legal limit is .05, and if you're over the limit you lose your license for a period ranging from 3 months to forever, depending upon how far over the limit you are and how many times you've been caught.

Every tiny town in both countries has a bakery or three, and these aren't donut shops, they mainly bake stuff like meat pies and sausage rolls, and for the most part the meat pies are absolutely delicious. Lots of variety and all of it good. And across from every bakery is a fish and chips place. They do fish of various species, not just generic fish, and the fish are terrific. The chips are simply fries and no better than anywhere in the U.S. but I could eat the fish every day.

They are also big on a chicken thing that's like pressed, battered, fried chicken parts in a big slab, but it's delicious as well. On the other hand, they don't do much of anything else all that well anywhere we ate. They love beets. Their burgers are huge and have thick slices of beets on them, along with lettuce and tomato and "tomato sauce", which is catsup, but they don't much use mustard.

New Zealand is really big on hedgerows. Hedgerows that are out in the middle of nowhere, and are so well-trimmed and maintained that they look like huge green concrete walls with perfectly straight sides, 10-15 feet high and 4-8 feet thick. Anyplace that is farming country is divided by thousands of miles of hedgerows like this.

New Zealand, both islands combined, has 4 million people and 50 million sheep. I never imagined there was that much of a market for wool in the whole world. They also grow a lot of red deer, the European version of elk, along with a couple other exotic deer species, to sell the antlers to the Chinese and for venison in the stores and restaurants.

The highest mountains in NZ only go up to about 10,000 feet, but they rise up out of very low ground or right out of the sea on the west coast, so they are incredible. We saw a number of the sights where the Lord of the Rings movies were filmed, and the country has really made a big deal out of being the site of "Middle-Earth". But it truly is spectacular and unique country.

There are no native land mammals in New Zealand, but a lot of introduced ones have decimated the native birds. And so have a lot of non-native birds. On the other hand, there aren't any snakes. Australian possums vastly outnumber even the sheep, and in some places the rabbits are so thick the ground seems to be moving. Over 100 native bird species are now extinct, due to the invasives and human hunting from the Maoris on, including the largest known flightless bird, the moa, and the largest by body weight eagle, the haast's eagle.

North American conifers grow as well or better in New Zealand as they do in North America. We came across 150 year old redwoods in Wanaka that were nearly as big as those in the forests of California, and Douglas firs that were at least as big as any I've ever seen. And the firs are highly invasive and crowd out native species in a matter of decades. The whole settled part of the country is a clinic on what NOT to do with introducing non-native species. Only the trout seem to have been a pretty good idea.