Sunday, May 18, 2025

Latest Update on Using USGS River Gauges

 The U.S. Geological Survey real time river gauges have been invaluable to those of us who paddle, row, motor, and fish the streams of the United States.  But they have been going through a lot of changes in the last few years, a few of them good, most of them (in my opinion) not so good.  I've written here before on how to get the most out of them, and in many ways the changes have made getting the most out of them more difficult.  

I had worked out a perfect system for efficient gathering of the information I most needed on the old website.  I had bookmarked, both on my phone and on my laptop and desktop, a page that had a table of all available gauges for the states I was interested in, grouped by river system.  I would go to that page, and it listed the gauges, the links to each gauge, and most importantly, the present discharge in cubic feet per second AND the median discharge for the day.  The median is a good approximation of normal.  So I could immediately see what any stream in that state I might be interested in was flowing, and how close it was to normal flow.  Very often that's all I needed to know; if it was near normal and there hadn't been any significant rain in the last few days, I knew the river was floatable or fishable.  And it there had been rain or if the gauge showed levels well above normal, then I could click on the link to that gauge and see exactly what was happening.

So imagine my dismay when, a couple months ago, I clicked on that statewide streamflow table page in my favorites, and the page was GONE.  The easiest, simplest, most useful single page in the whole river gauges website, and they dumped it.  There was a place to register comments, and I immediately clicked on it and complained.  I got a nice response back saying basically nothing, and not acknowledging how stupid it was to get rid of that page.  

Instead, there was now a map, showing the counties of the state, with little tiny dots to click on for each gauge.  You have to be terrific at geography to know the exact location within a county, or even which county, a given gauge is located.  It was basically guessing, clicking, and seeing if the right gauge came up.  All that info on present flow and median flow was just gone.  One thing the response to my comment did say was that I could put gauges into a "favorites" page.  Otherwise, my only choices were to click dots on that map, or scroll down through the list (which in most states is 200 or more gauges) to find the gauge I wanted.

So, I started exploring that "favorites" idea.  Well, it turns out to be SLIGHTLY more useful.  You can eliminate all the gauges you're NOT interested in within the state.  You can make your list of favorites be grouped by river system and not county, which helps considerably to find them.  You can even click on one button once you get your favorites page up, and have it show the present levels in feet and discharge in cfs for every gauge in your list.  But NO option for it to show the median flow.  For that, you have to go to the individual gauge page and click a few more times.

Since I live in both Missouri and Montana part of the year, and also do some floating and fishing in Arkansas, I needed to set up favorites pages for all three.  Most people probably wouldn't need to do so; their home state is probably all they are usually wanting to bookmark.  And they might not be interested enough in streams on the other side of their state to bother putting them in their favorites list.  For them, the favorites list would be fairly simple to use.  For me...I started out with 85 gauges in my favorites list for Missouri alone.

So, here is my latest revision on how to use these river gauges.  They are still extremely useful, but it's just more difficult to use them.  Note: I'm going to attempt to do this using my iPhone, since that is probably what most people usually use, rather than my laptop.  

You can start out by doing a Google search for "usgs river gauges (your state)".  When I did this for Missouri, the top search result was "USGS Current Water Data for Missouri".  I clicked on it, and imagine my surprise when the old beginning page popped up, with a map showing all the gauges, showing the counties, AND showing the streams the gauges were on (though it didn't name the streams, just showed their courses, so you have to be familiar with the statewide drainage patterns to really know that the particular gauge you're interested in is on that particular little squiggly gray line.  Here is what the map looks like, zoomed in on my phone so I can click on a gauge if I wish:


You will note that you can barely see those little gray lines showing the rivers, and you'll have to zoom in farther in order to accurately click on some gauges.  This may or may not be helpful to you in trying to find a gauge easily.  Also note that the colors of the dots are meant to signify whether the stream at that gauge is low, high, or normal
.  

I also saw that there is still a spot to click to get to the "statewide streamflow table", but alas, when you click on it, it takes you to this page instead, just as my old bookmarks did:


Scrolling down a bit, you come to this map:


It shows the gauges, but not the streams.  I'm familiar enough with the streams of the Ozarks to make a pretty good guess at where each gauge on a fishable river is located, but most people won't be.  

So scroll down a bit farther, and you come to this:


This is where you can start building your favorites page.  The first thing I did was change the "Group monitoring locations by" to "HUC-06 basin".  This will group the gauges by river basin, not county.  Now scroll down farther and you will begin to see a list of each gauging station, under the headings of the river basins:

Here you can see boxes to click for each gauge to "Select for My favorites".  There is also a box just beneath each river basin heading to select all the gauges in that river basin for your favorites.  So I just went down through the list, quickly eliminating whole river basins in northern Missouri which I didn't care about, and clicking on the gauges I wanted to add.  Once I got that done, I clicked on "view your favorites page".
 
Now...your "favorites" page should look like this:


If you scroll down, you'll get to the list of each gauge in your favorites.  But there is one more thing you can do to make things a little more helpful.  Scroll across the boxes you see in the middle of this page until you see "Graph favorites".  Click on it.  Then right below the boxes you see "Select a graphing option".  Click on "Show selected locations and data types as graphs on a single page".  Scroll down and it will show "Step 1 - Select data types to graph"  Click on "all" just below that.  Scroll all the way down the list of gauges in your favorites that follows until you reach the end of them and get to "Step 2 -View your graphs".  Click on "Grouped by location".  That takes you to a new page; "My favorite monitoring locations - graphed".  It took a long time to get here, but this will show graphs for both height in feet and discharge in cubic feet per second for every gauge in your favorites list...AND in the graphs for discharge, it will show little gray lines for each day that signify the median discharge for that day.  As you scroll down, an individual gauge graph for discharge will look like this one:

You can see the dark blue line is the discharge for the last seven days, and the little gray horizontal lines are the medians for each day.  So as I type this, the Gasconade near Hazelgreen is flowing 434 cfs after dropping from close to 900 cfs back on May 12.  The median ranges between 900 and 1000 cfs.  You can also use your finger to slide the little arrow beneath the graph to show the exact discharge at any time during that last seven days.  And if you need more information, you can click on "View Monitoring location page" at the top to go to the actual full page for that gauge.  You can also scroll back up to the top of the page and change the time graphed from the default 7 days to 2 days, 30 days, or 120 days.

This is the page to bookmark.  I'm still trying to decide if it's actually more friendly than just bookmarking your favorites page and then clicking on individual gauges, however; for me, it took a long time to scroll down through the 80 or more gauges I started out with, in order to find the ones I wanted to view.  So I figured that I would narrow it down to the streams I actually fish more than once every few years.  That still gave me about 40 streams.  So I further narrowed it to the streams I know I check all the time.  That got it down to 32 in Missouri. Next I went back to step 1 on the My Favorites page, and selected ONLY the "discharge, cubic feet per second" for each gauge.   When I scrolled down to step 2 and hit "view graphs grouped by location", it was manageable.  Now it appears to be the best option available to somewhat replace my old "Statewide streamflow table" as my starting point when investigating the water conditions on my usual stretches of stream.  It tells me the present discharge and the median for the period, but it still takes more time to scroll down through all of them instead of just seeing that info in a table.

I've always said that the USGS river gauges are better than any of the apps you can get, since the apps all use the USGS gauges for their info, and do not offer as much info as the gauge pages themselves do.  But given the number of steps it now takes to access all the information I want in the USGS gauges, the question arises whether the apps are now better or easier options.

So I got several free apps onto my phone, and the answer to that, for me, is still no.  RiverApp is probably the best of them, but the closest it comes to showing the VERY important information on median (normal) flows is a line on the graph showing the yearly average flow at that gauge.  That is NOT good information.  And if you pay for the premium, you get MONTHLY average flows.  Average flows are NOT median flows.  Average flows are skewed upwards by big floods in the past, that are figured into the average.  The average flow will always be significantly higher than the median, which is the flow at which 50% of recorded flows for that day are higher, 50% lower.  It's a far better approximation of normal flow for the date.

Let me give an example.  The upper Jacks Fork in Missouri is a premier float stream that unfortunately is normally too low to float by early June.  Right now, in mid-May, the USGS gauge shows the median to be around 220 cfs.  But the RiverApp shows the yearly average to be about 270 cfs.  So, for this particular time of year, there isn't a whole lot of difference between the yearly average per RiverApp, and the median per the USGS.  But...by August, the median flow of the upper Jacks Fork will be around 50 cfs.  And RiverApp will still be showing that yearly average of 270 cfs! 

So I'm not impressed yet with the apps. At present, my system will be to bookmark the opening page for each state, like that "USGS Current Water Data for Missouri".  That gives me that map I can click on for any gauge in the state.  Then I've also bookmarked the "My favorite monitoring locations - graphed" for the states I want.  That gives me quick access to the discharge graph with median flow shown for the gauges I use all the time.  From there, I can click on the link to any individual gauge page to go more in depth on information.

So let's visit an individual gauge page to further explore what you can learn from them.  I clicked up the page for the Meramec River near Sullivan; that's the gauge that is most useful for the stretch of the Meramec I fish most often (it's close to my house in Missouri).  Back when I was setting up all those pages, there was a spot to click on to make the "Discharge, cubic feet per second" graph the one shown when you open the page; the default is to show the height in feet graph.  I'm assuming you may not have found that button, so here is what your opening screen will look like for that gauge:

Gauge height in feet is useful for some things, but for basic info on a stream you are wanting to fish or float, it tells you nothing unless you already KNOW the water conditions that any given height in feet represents.  Why?  Because height in feet is different for every gauge.  It's an arbitrary number.  2.5 feet might be very low on one gauge, and higher than normal on the next gauge downstream.  We will get back to when you DO want to use height in feet, but for right now, let's get to discharge in cubic feet per second.  You scroll down and you will find a "Graph it" button for "Discharge, cubic feet per second", as shown here:

Click on it you will get the graph for cfs, as shown here:

You will note that the graph also shows the median for each day as the little horizontal gray lines.  If it doesn't, there is a place scrolling down to click to get the median.  You will also see that arrow and slider right below the graph.  You slide the arrow with your finger to get the exact discharge at any time during the period.  

You can also see some things to click right below the graph.  "Show legend" explains the lines on the graph in case you didn't know.  "Show graph details" gives you the exact latest reading on the graph and what time that reading was.  "Show today's statistics" is a little more important and interesting.  When you click on it, you will get "Statistics for (today's date) based upon (a number) years of data".  The number of years is how long the gauge has been recording.  The most accurate gauges on things like median flows are those that have been operating the longest.  In the case of this gauge, it has been operating for 93 years, so it has a LOT of data to use for its statistics.  

Below that are numbers for the "low (a year, in this case 1932), "25th", "median", "75th", "mean", and "high (a year, 2002 in this case)".  The low is the lowest discharge ever recorded on this date for this gauge.  The high is the highest ever recorded.  The mean, as we've mentioned before, is the average of all flows recorded on this date.  While interesting, they aren't usually useful.  The 25th is the discharge at which only 25% of the flows recorded for the date have been lower.  The 75th is the discharge at which 75% have been lower.  And the all important median is the flow at which 50% were greater, 50% were less.  As a rule of thumb, if the median represents normal, the 75% figure is something close to the maximum flow that will still be floatable and fishable.  The 25% figure is the flow where the river here is really getting low.

Scrolling on down on our gauge page, we see a map with the exact location of the gauge marked.  This can be very important on an unfamiliar river.  For instance, there is a gauge on the Jacks Fork that just says "Jacks Fork at Alley Spring".  But the gauge, as zooming in on the map shows, is under the bridge there, which is UPSTREAM from where Alley Spring, a huge spring, enters the river.  So that gauge is useless for Alley Spring downstream.  It is only useful for the river above the bridge.  If you put in at the bridge expecting 150 cfs because that's what the gauge shows, in a quarter mile you will pass Alley Spring and be on more than twice that much water.

In gathering info on any river, you have to first learn where the gauges are and what kind of springs or tributaries are coming into the river in between them.  The map shown on the gauge page not only gives you the location of the gauge, if you scroll around on it or zoom out, it will show other gauges on that stream, if any, and you'll also be able to see where tributaries enter the river.

Getting back to our gauge we've been exploring, if you scroll around on the map moving upstream, you'll find that there is a gauge upstream near Steelville, with Huzzah Creek, a major tributary, entering between the two gauges.  So it stands to reason that the Steelville gauge should show a lot less water than our Sullivan gauge.  You will also see that there is a gauge on Huzzah Creek, which can give you more information on what kind of water is coming downstream, which can be useful if there has been a lot of rain in the area.  There is also a gauge close to the headwaters at Cook Station; another source of info on what you can expect in the next day or so.

While we're talking about possible high water coming down the river, let's get back to that graph for height in feet that you may have gotten in the beginning, and can go to by clicking on the button for "graph it" "Gage height, feet":

Before I go on, I just want to mention that the USGS uses the spelling of "gage".  I used to use it as well when I was writing about the gauges, but got too many people complaining that I didn't know how to spell.  So I've started using "gauge" instead.

While the discharge in cubic feet per second is a universal measure for any gauge, it is often hard to picture what a rise in the river looks like in cfs.  You don't know whether an increase of 500 cfs is a huge rise or barely a blip.  But most people can picture a rise of 2 feet.  If you look at the graph, you'll see that on May 13 the river jumped abruptly as heavy rain hit the area.  But the graph shows the rise was only about 0.7 feet.  As a rule of thumb, you can figure that if the river has been stable and not high, a rise of less than a foot means it hasn't changed much and will still be floatable and fishable.  1-2 feet is a more significant rise; the river will still be floatable and may be clear enough to fish, but the current will be moving you downstream in a hurry and you'd better be on your toes.  2-3 feet means it's for the very experienced only, and probably too muddy to fish.  Over 3 feet...stay off it.  You might find it easier to paddle, but the consequences of mistakes can be severe or deadly.

So height in feet is useful for judging how significant a rise in the river is. That is about all it tells you as far as the floatability and fishability of the river.

There is one other bit of often useful information you can still get from the gauge, but I don't know how much longer it will last, and I've been unable to find it on the new pages themselves.  If you scroll back to the top of our gauge page we've been discussing, you'll find a link to "Legacy real time page".  Clicking it will take you back to the format of the old pages after a blurb saying that the page is going to be discontinued at some point.  Scroll down a bit and you'll find this to click on:

See that "Current stage-discharge rating"?  Click on it and it will give you a table that looks like this:

This takes a bit of explanation.  Any gauge does measures ONLY height in feet.  That is the raw measurement.  To convert height in feet into discharge in cubic feet per second, actual people have gone to the gauge site at different water levels, and physically measured the flow in cubic feet per second, and they periodically go back and remeasure it.  Thus they come up with a table that matches different heights in feet to the flow in cubic feet per second.  Those three columns on this page show that table.  The column on the left is a given height in feet.  The column on the right is its corresponding discharge in cfs.  The middle column doesn't matter for out purposes.  So if somebody tells you that a month ago the height in feet on the gauge of the river they fished was 2.3 feet, but they didn't check the discharge in cfs, you can go to this table and see what the river is flowing in cfs at a height of 2.3 feet.

In conclusion, I hope this helps you to understand the new gauge format, and how to find the most useful features.  There is a wealth of information in these gauges that most people don't know how to find or use.  They could be made easier and more user friendly, but once you learn to use them, they are better than any of the apps.


Tuesday, October 25, 2022

Learning the new USGS real time river gage pages

 For those of us who depend upon the US Geological Survey river gages, the day has finally come when they are switching over to the new format.  I had explored the new pages a few times, but was holding off on really diving deeply into the information in them, but today when I clicked on a gage, for the first time the new format appeared instead of the old familiar page.  

It is always difficult to switch over from the intimately familiar to something new.  And in playing around with the new format, I had not been impressed.  There was a lot that seemed to be either missing, or more difficult to reach.  But a deeper dive into the information shows that most of what I've used in the past is still available, though some takes a few extra steps to reach.

Most people do not use a tenth of the information these gages contain, anyway.  But in fact, most people don't realize how many ways they can be useful, nor do they understand the main pieces of information--gage height in feet, and flow in cubic feet per second.  I've been on a bit of a crusade for many years to get people to use the flow in cfs, rather than the height in feet, in determining water conditions.  Flow is, quite simply, the volume of water flowing past the gage at any given time.  A reading of 20 cubic feet per second is 20 cubic feet of water flowing past the gage each second.  It is the same volume, no matter which gage you're reading; a reading of 100 cfs on one gage is the same volume of water as 100 cfs on any other gage.  On the other hand, the height in feet is unique to each gage.  A reading of 2.5 feet on a given gage is NOT the same as a reading of 2.5 feet on another gage; on one gage it might signify that the river is very low, on another gage, even on the same river, it might show the river at that point is a couple feet higher than normal.  So unless you already know what 2.5 feet signifies on a given gage, that number will mean nothing.  In other words, the flow in cfs is a universal measurement, but the level in feet is different for each gage.  There actually ARE ways in which the level in feet reading can be useful even when viewing a gage on an unfamiliar river, however.

With that in mind, perhaps we're reading to take a dive into the information contained in the new gage format.  Note that I'm showing the screen shots from visiting the gage on a laptop; the same images open on my phone as well, but in a slightly different proportion--you will have to do a bit more scrolling to reach each part of the page.

When you open a page, this is the information that immediately comes up:

The first thing to note is that you can still reach the old style gage from this page; you'll see a spot to click on "legacy real-time page".  Who knows how long this will still be available, but it's still a possibility right now.

Next, what jumps out is that the graph is for gage height only, unlike the old style gage page that showed graphs for both gage height and flow in cfs.  Keeping in mind my pleading to get used to using the flow and not gage height, this is the first disappointment.  Never fear, you can still get to a graph for flow, it just takes an extra step.

On the other hand, the first thing that is actually easier to do is to change the time span shown on the graph, at least from the default 7 days shown to either 30 days or a year.  You can see the button just above the graph.  While this isn't particularly useful for determining present water conditions, it's a convenient feature for those of us who want to go into more depth on river information.

There is also a convenient feature on the graph itself.  At the top of the graph in orange letters, it shows the exact gage height at the latest time the information was updated.  If using a laptop, running your mouse across the graph moves a dashed vertical line across the graph, with a black dot where the line intersects the orange height reading line.  The readout at the top of the graph changes to show what the exact height reading was at that point.  So you can run back to any given point on the graph (any point in the last seven days in the default setting) and see what the exact river level was.  Here, I have moved the vertical line back to around the beginning of Oct 23, and you can see that at 11:45 PM on Oct 22, the river was at 1.34 ft.
You can use your finger to do the same thing on your phone if it's like my Iphone.


There is also another way to zoom in on the graph to show shorter time periods.  There is a bar with handles just below the graph.  Using those handles, you can move in to show any time period within the default 7 day graph.  Here, I've dragged the left handle to the beginning of Oct 23, and the main graph has zoomed into just the time period in gray on the handles bar.
However, on my phone, this bar with handles does not show up.

A few other things to note on this top portion of the page shown...the level considered minor, moderate, and major flood stage is interesting.  And the button to click to "compare to last year" is also a fun piece of info to see.  Neither is very useful for determining how floatable or fishable the river is now, though.  There is also a button to "display median", but it is inoperable when the graph for height in feet is displayed.

So, scrolling down the page to the lower portion, we see this:
Aha!  Now we have a button to click on to change the graph from height in feet to "Discharge, cubic feet per second".  So one click will change the graph to what I really want to see.  It will also make the "display median" button operable.  So, clicking on the discharge button and the median button, we get this graph:
The graph is now for flow in cubic feet per second, and the median is shown as a dotted line going across the graph.  Median is a VERY important piece of information.  It is a good approximation of the normal flow for the time period, so we can see in this case that the flow was a bit above normal, even before the rain a few hours ago raised the river slightly.

On the old page, there was a table that showed the exact median flow for the present day, but alas, that table is missing on the new pages.  You can still get that information as well, it just takes more time and clicks.

Another feature is that you can click on the button "Select data to graph on second y-axis", and then a couple other buttons will appear.  You can click on the "gage height, feet" button, and get the gage height onto the same main graph.  The other button on this particular gage is "precipitation, total, inches".  Not all gages will show precipitation.

The next option down the page is "Today's statistical data".  Clicking on it gets you that table I mentioned above showing the median and other info on the old gage pages. That info includes the latest value of streamflow, the lowest ever recorded on this date, the 25th percentile, median, 75th percentile, mean, and highest value ever recorded on this date.  Here is the table:
Of this information, median is the most immediately important.  Median, as I said before, is a good approximation of what the river normally flows on this date or time of year.  It is the flow of which 50% of all recorded flows for the date are lower, and 50% higher.  The 25th percentile value is the flow number for which only 25% of the recorded flows were lower, and the 75th percentile is the flow number for which 75% of recorded flows were lower.  The mean is the average of all flows recorded for the date.  You might think it would be a better approximation of normal than the median, but it is not, because any really high water recorded on the date skews the average upward; the mean is always a significantly higher figure than the median.  The lowest value and highest value show the lowest and highest flows ever recorded for the date, and the year in which they were recorded.

The next menu is the "Hydrograph data table(s)".  Clicking on it gives you all flow figures downloaded from the gage and the times they were sent.  It is not particularly useful for recreational purposes, so you can just ignore it.

Below that is a map showing the exact location of the gage, and the extent of the watershed feeding the stream down to the gage.  It also shows other active gages (monitoring locations) on the stream and surroundings.  This can be very important info on an unfamiliar gage.  In this case, knowing that the gage is downstream for such sources of flow as Maramec Spring, Dry Fork, and the entire headwaters area of the river, but upstream of the mouth of Huzzah Creek, tells you that the gage is most useful for the stretch of river between Maramec Spring and the Huzzah.  

The next menu is "Summary of all available data".  Clicking on it doesn't give the recreationalist much good info in itself, but it brings up another link to click on, "Water Data for the Nation Inventory".  This gets you into some real meat as far as river gage info goes.  It brings up a different page that looks like this:
Clicking on "Current/Historical Observations" just takes you back to the new gage page.  "Daily Data" actually takes you to something resembling the OLD gage page, but with the default of showing the gage height and flow rate graphs for the last year.  You can change the dates and time periods shown if you wish.  The graphs:  
There is one more piece of info that I find useful to get from this page. Near the top of the page is a link to "Current stage-discharge rating".  Clicking on it, you get this:
It may look like gobbledegook, but scroll down past the first part to the three columns of numbers, which will continue farther down the page than shown here.  These numbers will take just a bit of explanation...

River gages actually measure the water height.  Basically, a gage is a vertical tube, with the bottom down in the river water, and the top way up above normal river level.  There is a float inside the tube that goes up and down as the river level comes up or down within the tube.  Gage height readings come from that float.  Periodically, USGS personnel visit the gage and measure actual flow in cfs, and also measure the profile of a cross section of the river valley at the gage.  Then they estimate the flow rate in cfs at every given water height, and make up a table of these values.  So when you see the flow in cfs graph and numbers, these are actually the estimated flows in cfs for the given, recorded gage height.  Since the profile of the river bottom and banks can change with each high water, these values will also change; a gage height of 2 feet might not mean the same flow in cfs after a flood as it did before the flood if the flood changed the banks or bottom of the river at the gage.  That's why the personnel periodically check the accuracy of the tables they have.  

So the columns of numbers on the page we are now discussing are the height and corresponding estimated flow in cfs.  The gage height numbers are in the left hand column, the corresponding flow rate numbers are in the right column (the middle column is not important to our purposes).  The numbers start with the lowest possible height reading (basically the bottom of the gage tube), and go to the highest possible reading at the top of the gage tube.  Note that most gages have their bottoms well under the lowest level the river has ever dropped to, so the numbers at the top of the columns are so low that they will probably never actually be seen in a gage reading.  If we scroll down the page a bit, we will get into more realistic numbers:
So you can see here that, for instance, a gage height of 2.30 feet (from the column on the left) means the river is flowing an estimated 644.24 cubic feet per second (from the column on the right).

This may be diving farther into the weeds than most users will ever need, but if you really want to go in-depth on river information it can be useful.

The next menu is "Daily Statistics".  It is another one that can be useful if you want to go deeply into the information available for the rivers.  Clicking on it brings up this page:
It shows the available data being the discharge in cfs for the time period from, in this case, 1922-10-01 to 2022-08-17.  Click on the box on that, and then down below, you can make choices on the date range of the data you want to see, and a drop down menu of which table you want to see.  The default is "mean", but if you click on the menu it will give you the choices of minimum, maximum, and a bunch of percentiles including "median".  We already know that median is far more useful than mean or any of the percentiles.  Minimum and maximum will give you the highest and lowest values ever recorded for each day of the time period you select.  But, let's select a time period beginning with the earliest data and ending in the latest available, from Oct 01 1922 to Aug 17 2022, and then select median from the drop down menu.  Hit "submit", and it gets us this:
  This is a table of the average median value for every day of the year throughout all the years of record available.  In other words, this is a table of what normal flow for the river at the gage site should be on every given day.  So if you want to know what the river should normally be flowing on, for instance, March 15th, 555 cubic feet per second is your answer.  More interestingly, you can look at this table and see that the river normally flows more water at certain times of the year than others.  In April and into May, it normally flows the highest, 500 to well over 600 cfs.  While in September and October it will normally flow less than 200 cfs.

The next menu is "Monthly statistics".  Clicking on it gives you similar choices but by month instead of day, and only for mean values.  For our purposes it isn't very useful, for it can be fun to play around with.  "Annual Statistics" is similar.  You can pull up the annual mean for each year of record, which can show you which years were drought years and which were more normal or high water years, but it isn't useful for recreational purposes.

"Peak Streamflow" simply gives you the highest flow recorded for every year.  It is also interesting but not useful for recreation.  The rest of the choices are useless for our purposes.

So there you have it, a summary of the data contained in the new USGS river gage pages, and how to access it.  If you are a floater, an angler, or anyone wanting to find out about water conditions on a given stream, the new pages are very useful but take a bit of getting used to.  Here is how I typically use them:

First, go to the USGS river flows data for the state you're interested in.  Here is the page for Missouri:

 
https://waterdata.usgs.gov/mo/nwis/rt

On that page, you will see a link to "Statewide Streamflow Table".  Click on it, and you get this page:

https://waterdata.usgs.gov/mo/nwis/current/?type=flow

It will look like this:
Note that over on the left are links to click on for every gage in the state.  On the right are figures for "Discharge, ft3/s" (that's what the stream at each gage is flowing presently) and "Long-term median flow (present date)" (that's the median or normal flow for the date).  So immediately, you can see what the river is flowing now and compare it to normal.  Much of the time, that's all you need to know.  For instance, scrolling down the page, which is grouped by major river systems, to the Meramec River system, we get this:
Say I'm wanting to know what conditions are on Big River near Richwoods, because I'm wanting to fish the lower middle river.  I can instantly see that the normal flow there is 164 cfs, and it's flowing 190 cfs right now.  That's plenty close enough to normal; the river should be in good shape.  If weather conditions were stable and there hadn't been any rain in the last day or so, that would be good enough, no need to actually even visit the gage page.  I have this page, the streamflow table, bookmarked on all my computers and my phone.  All I have to do is click on it, and scroll down to the river I'm interested in, and see if it's near normal or not.

But...it HAS rained in the last day, pretty heavily.  So is there maybe a slug of higher, muddy water moving down the river that just hasn't reached the Richwoods gage yet?  So I look at the upstream gages on Big River (fortunately there are several; some streams have only one or two gages on them).  I note that at Irondale, the highest gage, normal is 23.0 cfs and present flow is 55.8 cfs.  That's a bit of a rise, but not much.  If the river had risen several feet it would be flowing a lot more water than that.  No problem there.  At the next downstream gage, below Desloge, it's only flowing 98 cfs.  No big rise there.  Below Bonne Terre shows a more significant rise; normal is 60.0 cfs, it's now flowing at 265 cfs.  Okay, better go to that gage page and look a little more closely.  Here is the graph that comes up on the new gage page:
Now, here is where the height in feet graph does come in handy.  It's showing the river has risen from about 2.75 feet to 4 feet, and may still be rising.  That's a rise of over a foot.  A good rule of thumb is that a rise of more than a foot is fairly likely to mean a slug of muddy water.  So now my fishing trip downstream from there is looking a little more iffy.  Maybe I better either go now and hope I can get in some good fishing before the muddy water hits, or else look for a different place to go that isn't quite so chancy.

What if this was a few days ago, when the Missouri Ozarks had been in drought conditions quite a while, and all the rivers were low?  What if I wanted to float the Jacks Fork, and wondered if there was enough water to float from Bay Creek to Alley Spring? I would have gone to the statewide streamflow table that I had bookmarked, and looked at what the gage info said.  But...what if I was totally unfamiliar with the Jacks Fork, and didn't know which of the three gages on it to use, nor what flow would constitute enough water to float?  Well, then I would have to go to each individual gage page, and fist look at the map we discussed above to see exactly where the gage was.  It would show the "near Mountain View" gage to be farthest upstream, at the Highway 17 bridge.  Zooming in on the "at Alley Spring" gage would show it was at the Highway 106 bridge.  And most importantly, just UPSTREAM from Alley Spring itself, which we might know is a large spring that adds a considerable amount of water to the river.  So if we are floating down to the bridge at Alley, that gage is PERFECT for determining water conditions on that float.  So was there enough water?  A few days ago the gage was showing around 60 cfs.  And here is where a big rule of thumb for Ozark streams comes in.  To float any Ozark stream that can get too low to float, you need a minimum of 100 cfs to get down it without a lot of scraping bottom and maybe some walking shallow areas.  Knowing that easy to remember number, I would now know that the float down to Alley was going to be some work dragging a canoe or kayak here and there.  (Right now, as I type this, the Alley gage is showing 74 cfs--it's had a slight rise, but is STILL too low to float easily above there.)

What if I wanted to know whether the river BELOW Alley Spring ever gets too low to float?  I would go to the "at Eminence" gage page, which I know is downstream from Alley Spring. Then I'd go through the steps on the new page to reach that table that showed the median daily value for each day of the year, which I discussed at length above.  It would show this: 
You can see that there is no day of the year in which the median was under 100 cfs.  So normally, that stretch would not get too low to float easily.  If I still wondered if it could get too low during a really bad drought, I might change the drop down menu from "median" to "minimum".  This would give me this table:
See all those values below 100 cfs?  So it IS possible for the lower Jacks Fork to get too low for easy floating, but only if there has been a VERY extended drought.

You can use your imagination to see how many things you can learn about the rivers from the gages.  Knowing how to use them can save you a lot of drive time and phone calls and disappointments.  The new gage pages are good in some ways, not so good in others.  But they will serve the purpose well.  

The following are some of my own rules of thumb for determining water conditions from the gage numbers:

1.  The minimum flow for a stream being floatable without a lot of dragging and scraping--100 cfs.  I have floated plenty of streams at lower flows than this.  Even at about 30 cfs, narrow riffles may still be floatable.  But at anything lower than 100 cfs, wide riffles and split channels will often necessitate walking, and riffles with rocks and a lack of well-defined lines to run will be problematical.
2.  The optimum flow for most streams that are sometimes not floatable is 200-300 cfs.  At that flow nearly all riffles will be easily floatable, but the water won't be so high that the dangers are magnified.
3.  For those running jetboats, the approximate minimum flow for running an unfamiliar river is 500 cfs.  I've run stream sections at less than 200 cfs, but they are streams I know well.
4.  As for whether a stream is too high for safe floating, that is where I do use the graph for gage height.  First go back to the last time the river was stable, as in several days with little change in the level in feet or the flow in cfs.  Note the level during that time.  Then check how much higher than that the river is now.  If it's less than a foot higher, it should be good, not muddy and not really high.  If it's between one and two feet higher, it may be muddy and more caution should be used, because it will be moving fast and obstructions could be seriously dangerous.  Between two and three feet higher, it's going to be pushing the envelope for floating, and you should stay off it unless you have plenty of experience in big, fast moving water.  Over three feet higher, and it's getting truly dangerous.


Tuesday, April 5, 2022

Crazy Big Fish

 This is an old piece of writing from 2011.  That was a year of the periodic cicada emergence in Missouri, and we had a lot of them around the house.  The fish in the story, by the way, was STILL alive in my pond as of the fall of 2021.  

After supper this evening, I decided to take my lightest intact fly rod out to the pond beside the house to catch some small bass and bluegill to replenish my fish supply in the freezer. There are a lot of bass in the pond, probably too many, so I like to keep a couple dozen 10-12 inchers throughout the year, along with a bunch of bluegill. The bluegill are fairly big, 9-10 inches. The pond is somewhere between a half-acre and three-fourths of an acre in size, and 7-8 feet deep at the deepest.

The cicadas were on the water regularly and getting eaten just as regularly, but I decided to see if they'd take an ordinary white popping bug with black feathers. They did. Mary came out and caught five from one corner where the bluegill bed, but then decided it was too hot and headed for the house. I took a couple more from there, then worked my way around the pond, picking up a few bass. There is a shallow point where the bluegill also bed, and when I got to it I caught a couple more. I could see something moving just below the surface a little farther out on the point, and figuring it was a bass cruising for cicadas, I made a bit longer cast to reach it. The bug landed and the water bulged and moved a bit a couple feet away. Aha, I thought, the fish is moving toward the bug...

There was just a tiny "something" that happened at the bug, and it disappeared.

I set the hook, and instantly the water bulged in a boil the size of a bathtub. A bass? I knew there were a few bass in the pond that would go 6 pounds or better. The fish moved off the point toward deeper water, shaking its head. I could feel each shake...and they were really BIG shakes. Not quivers or jiggles or jerks, but hard, sharp, huge surges. This wasn't a bass, or if it was it was a record.

And then it dawned on me. At least ten years ago, I had put three small grass carp in the pond to control algae. I never saw more than two of them after that, but the two got bigger and bigger. They were shy and wary and really the only way I ever got any kind of look at them was if I climbed up on an observation deck we have on the roof of the house and watched carefully. I've plotted for years how to catch them, because I knew they were getting pretty big. The last couple years I've only seen one at a time, and I suspect that one is all that is left.

I had hooked that grass carp!

It took a good 45 minutes to land it on a 6 weight fly rod, which begs the question of whether I could have handled it at all on the 4 weight I usually use to catch bluegill. It ran all over the pond. I mainly held on, giving it line whenever it moved, slowly pulling it back toward me when it rested. A couple runs were truly epic, halfway across the pond in a second or two, but mostly it just swam around shaking its head and when I'd get it fairly close it would lunge out to the middle again. I really wanted to land it just to really see how big it was. It was hot, and I was truly getting tired. I wanted Mary to see this beast. I wanted a photo of it.

Finally I got it coming toward me for about the umpteenth time, and slid its head up onto the bank by backing up a few feet and pulling as hard as I dared. Then I ran down to it and grabbed it by the gill covers with both hands and dragged it up the bank. I left it a few feet from the water while I ran to the house to get Mary and a camera. She was flabbergasted to see this scaly monster. Here it is in all its glory:post-218-13071514792391_thumb.jpg

I decided to release it, and it took several minutes of moving it back and forth in the water to revive it enough for it to slowly swim away. I hope the old cow makes it.

It was getting dark and I suddenly realized I had a bunch of fish to clean. I looked down at the bank where I'd left my rope stringer full of fish, holding it down with my foot while I fished...I'd totally forgotten about it, and the fish had swum off with my stringer long ago, I guess.

John Day

 The first time I ever heard of the John Day River in Oregon was back in 1987, when I won the first of state Nevada Trout Stamp contest.  I had to go to a sports show in Reno to sign prints of the design, and the booth across from where I was signing at the show had a large mounted smallmouth hanging on the wall.  So naturally I went over and talked to the people there.  They were running trips on this river in Oregon that was full of smallmouth.  Well, I was interested.  Their photos of the scenery was nothing like what I'd pictured rivers in Oregon to be like, but what really turned me on was that they said they were the only outfit running guided trips on the river during the low water of mid- to late-summer, and in a five day trip we would never see another person.  So I traded a painting for a trip for me and Mary.

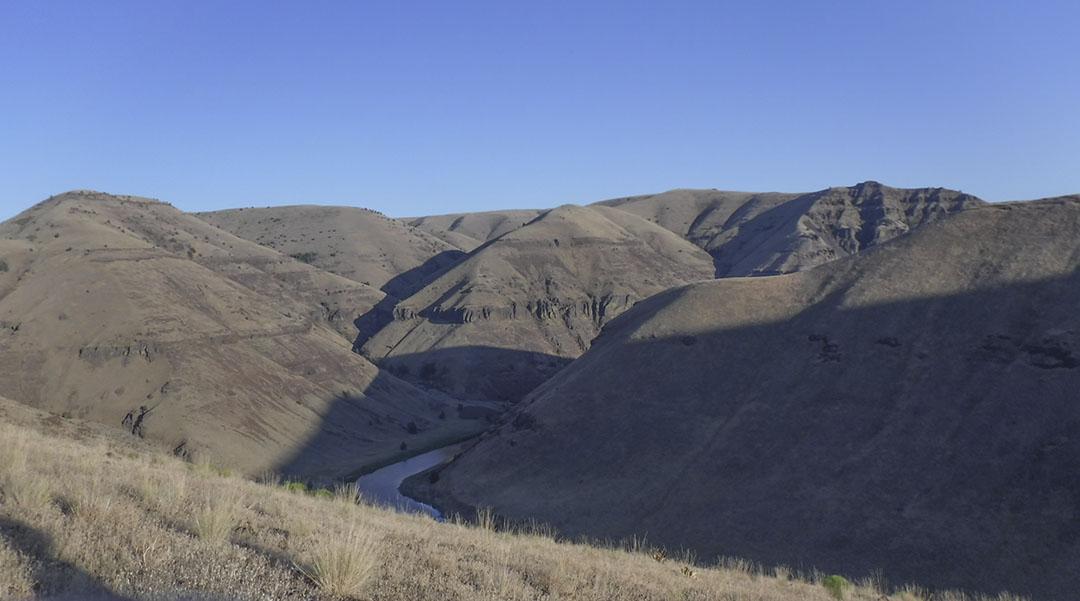
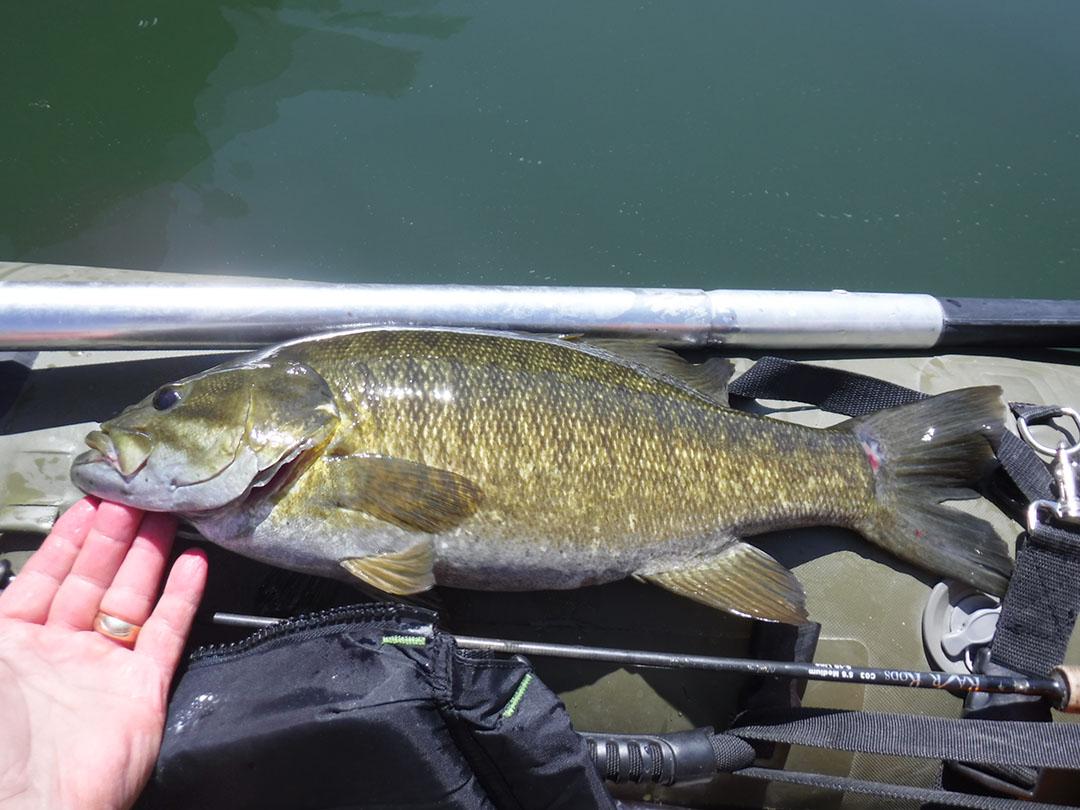
That trip, in 1988, was epic.  There were six other clients besides Mary and me, but all but one of the others were not serious anglers.  It wouldn't have mattered.  We all caught smallmouth until our hands were chewed nearly to ribbons from lipping and unhooking fish.  They came in all sizes.  The majority were under 12 inches, but there were plenty of 14-16 inchers and enough 17 to 20 inchers to keep us fishing like crazy trying to catch more of them.  I counted the number of fish I caught on my second best day of the five days we were on the river, and ended up with 175 smallmouth that day.  I probably caught at least 20 that were over 17 inches, topped by a couple 20s and a huge 21 incher.  And the scenery was simply spectacular.  The guides told us we'd never see but one sign of civilization, the roof of a shed that was atop the plateau, miles away, but could be seen briefly if you looked up a side canyon.  They were right.  They weren't right about everything...they told us not to worry about a tent because it never rained during the summer, but on our fourth night a huge thunderstorm struck and the 11 of us spent hours huddled under a 12 by 20 foot tarp, wind howling and trying to blow our shelter away.  Just one more facet of the story of that trip.

Naturally I had to go back.  Our second trip was a few years later with another couple, artist friends of ours, on a section farther upstream that wasn't quite as wild or scenic but was still pretty spectacular, as was the fishing.  Then in August of 1999, I did another trip on the lower wilderness section, this time with a different company, accompanied by cwc on here and two other Missouri anglers.  This time, the fishing was disappointing.  There had been a huge landslide farther up the river just prior to our trip, and the river was still working its way through the debris, fluctuating in flow and remaining very murky.  We only averaged about 25 fish a day because of those conditions.

After that, the river went on the back burner...still a stream I'd like to return to someday but not a priority.

But then I met Dirty Ed on the Riversmallies website, and fished with him and his two friends, Doug and John.  Dirty Ed's real name is Ken, and the three of them are from Ohio.  I don't know who first mentioned the John Day, but Ken really wanted to fish it, and I started getting excited to go back.  We tentatively set up a do-it-yourself trip for last summer.  But other things got in the way and I couldn't go, and besides, the river was extremely low by early July, so Ken and the others opted out as well.  But we were bound and determined to do it this summer.

It started out being a canoe trip.  The kind of watercraft you use on the John Day is somewhat dependent upon water level.  If it's flowing under 500 cfs, canoes and kayaks make the most sense, and typically by mid-July it's down below that mark.  When I had floated it before, it had been down around 300-400 cfs, and the first two trips we had used inflatable one person kayaks, while the guides carried all the camping and food gear in smallish rafts.  The third trip, we'd floated in one person pontoons propelled by kayak paddles, with again the guides using small rafts.  So obviously the river was doable at that level in rafts, though they weren't recommended below that 500 cfs mark.  And the fly in the ointment was that, because we were doing a DIY trip, we wouldn't be able to use the private access the guides used, which not only cut 14 miles off the trip but also was below the one true hazard, Clarno Rapids.  Clarno Rapids is rated class 3 and 4, and would either be dangerous to kayaks and canoes at flows above 500 cfs, or nearly impassible in rafts below 400 cfs, or so the guide books said.  So we watched river flows religiously as the time approached.  It looked for a long time like the flow would be right around that 500 cfs mark by the time of out trip; the river had been a little above normal all early summer, and though it was dropping steadily, the snow pack in the mountains at its headwaters was still substantial.  So by the time we absolutely had to make a decision on what kind of boats to use, it seemed rafts would be in order, and that's what we would end up taking.

Then the river started dropping much faster, and by the time of the trip, it was down below 400 cfs, and we were pretty nervous about Clarno Rapid.  Would we be able to make it in rafts?  Two more of my Montana buddies were going to go, and we planned to take three rafts.  John would row solo in a smallish raft and carry a good portion of the gear.  Ken and Doug would be in a smallish raft, and my two buddies and I would be in my bigger raft.  But at nearly the last minute, my buddies had to cancel.  Now I had to make a big choice...take the big raft by myself?  Or could I do it in my one person Water Master raft?  I decided to take the Water Master.

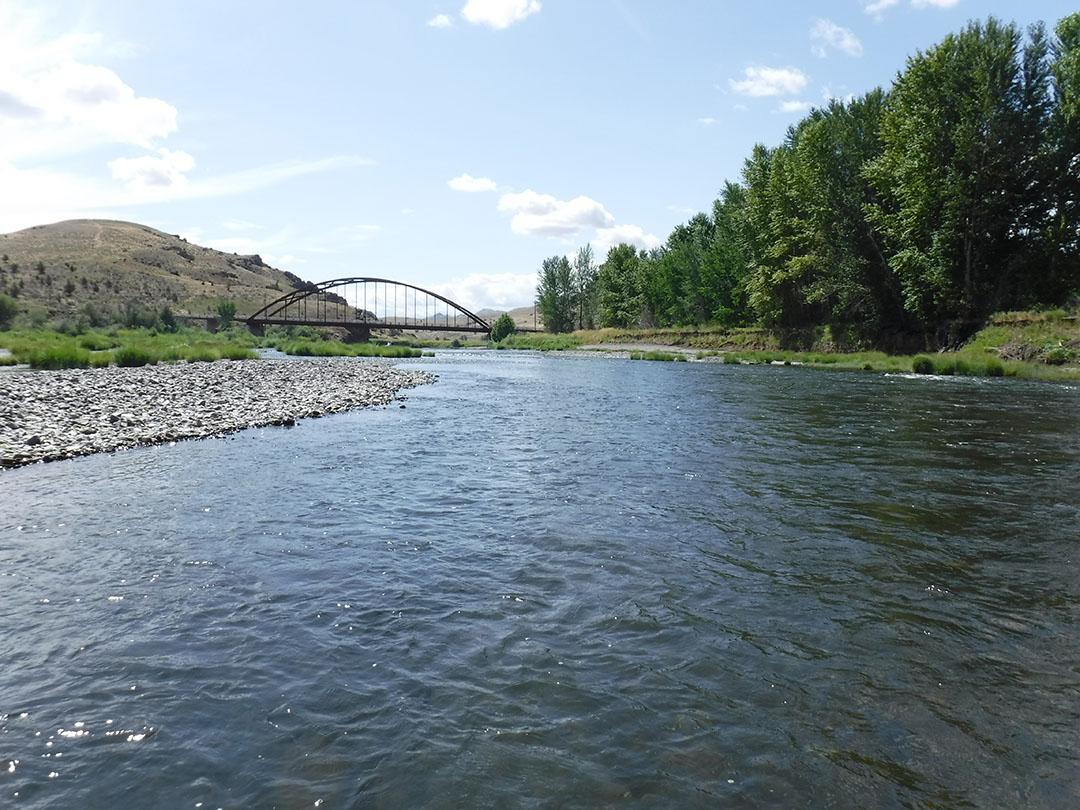
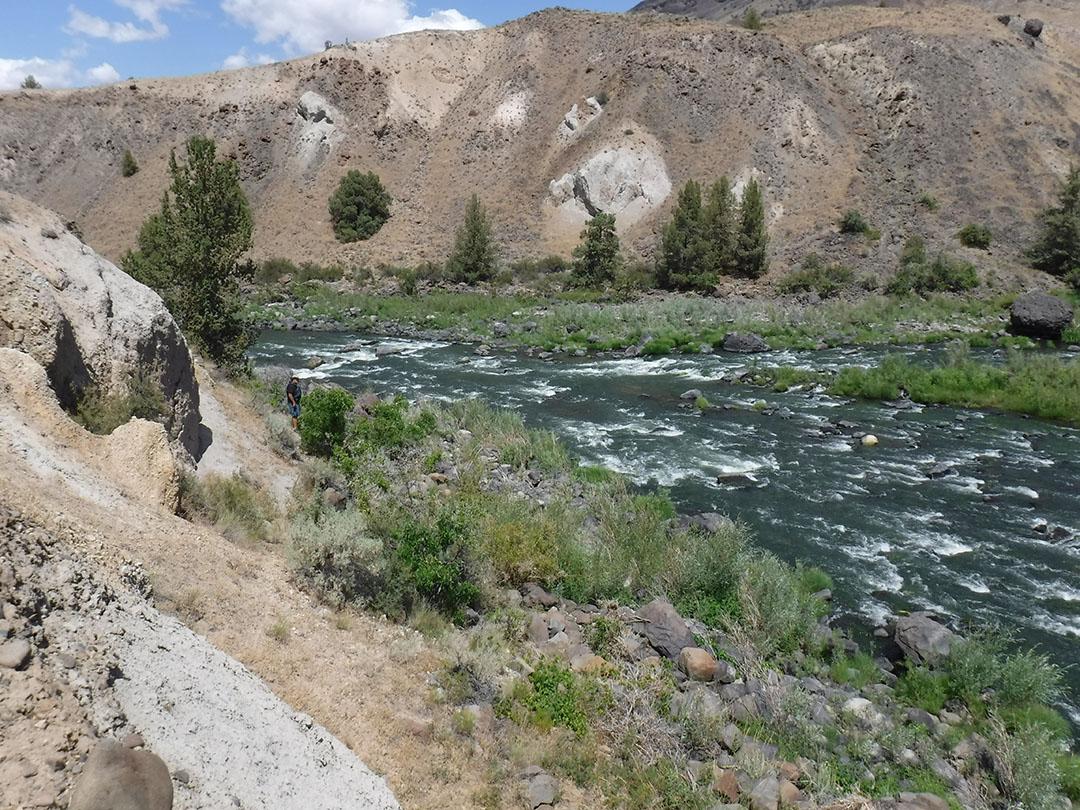
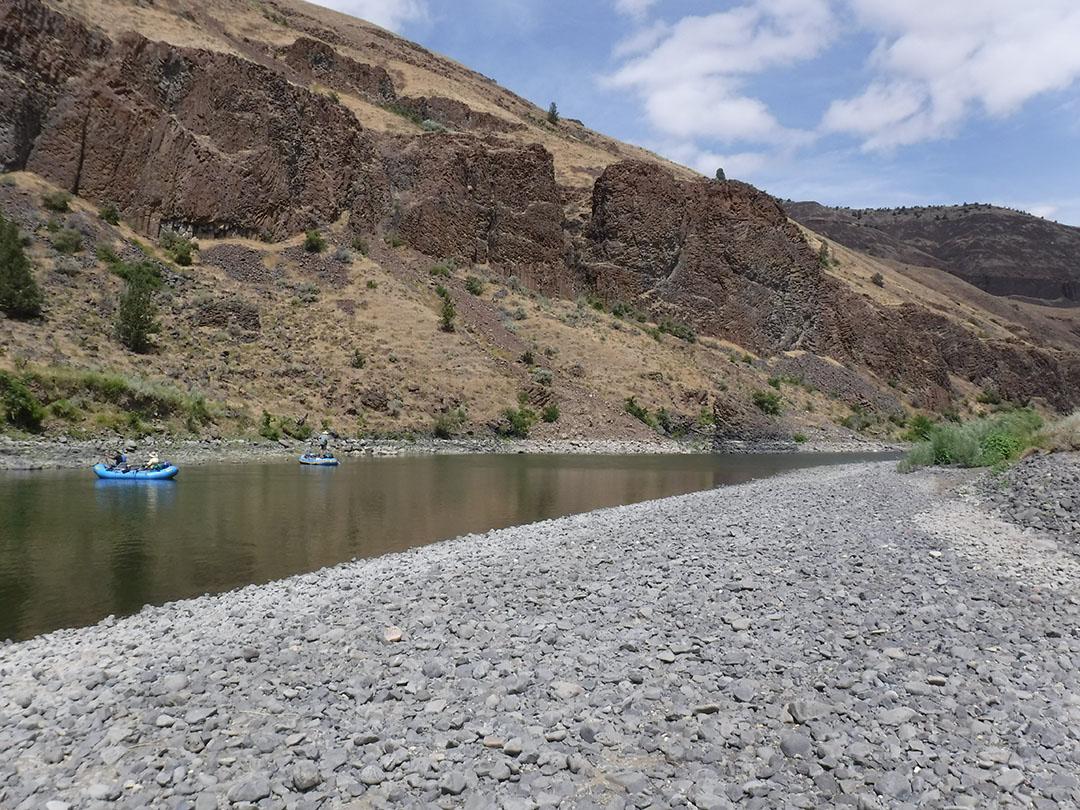
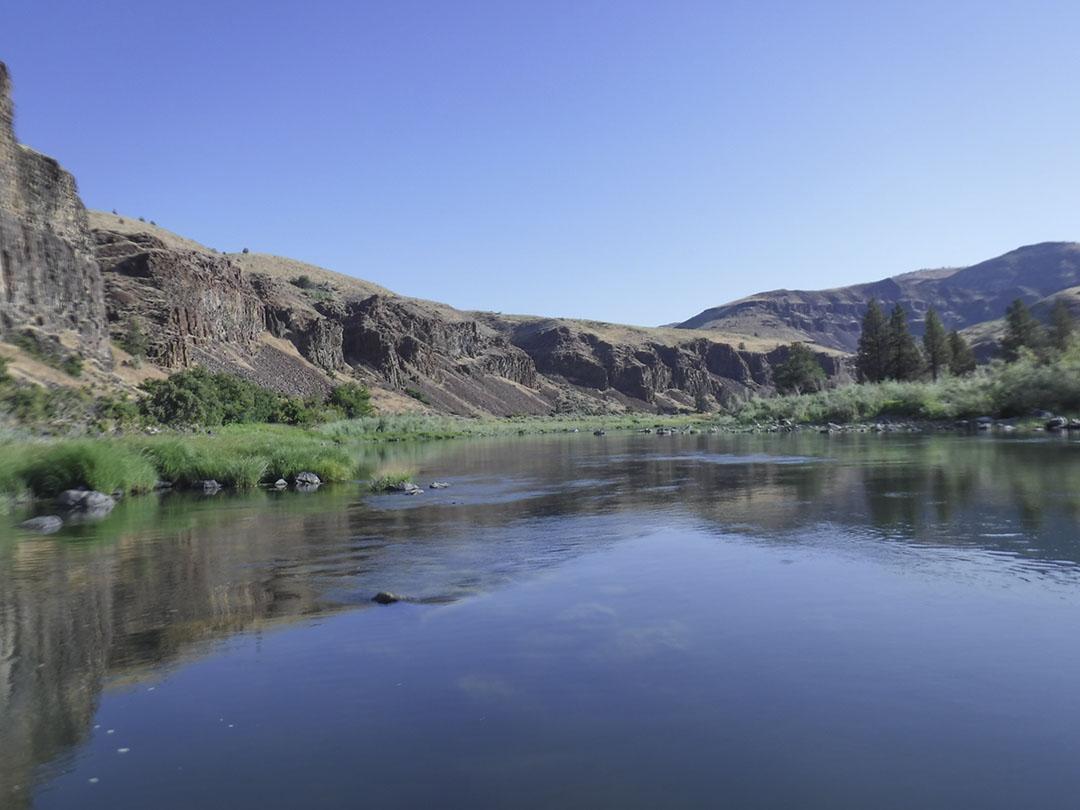
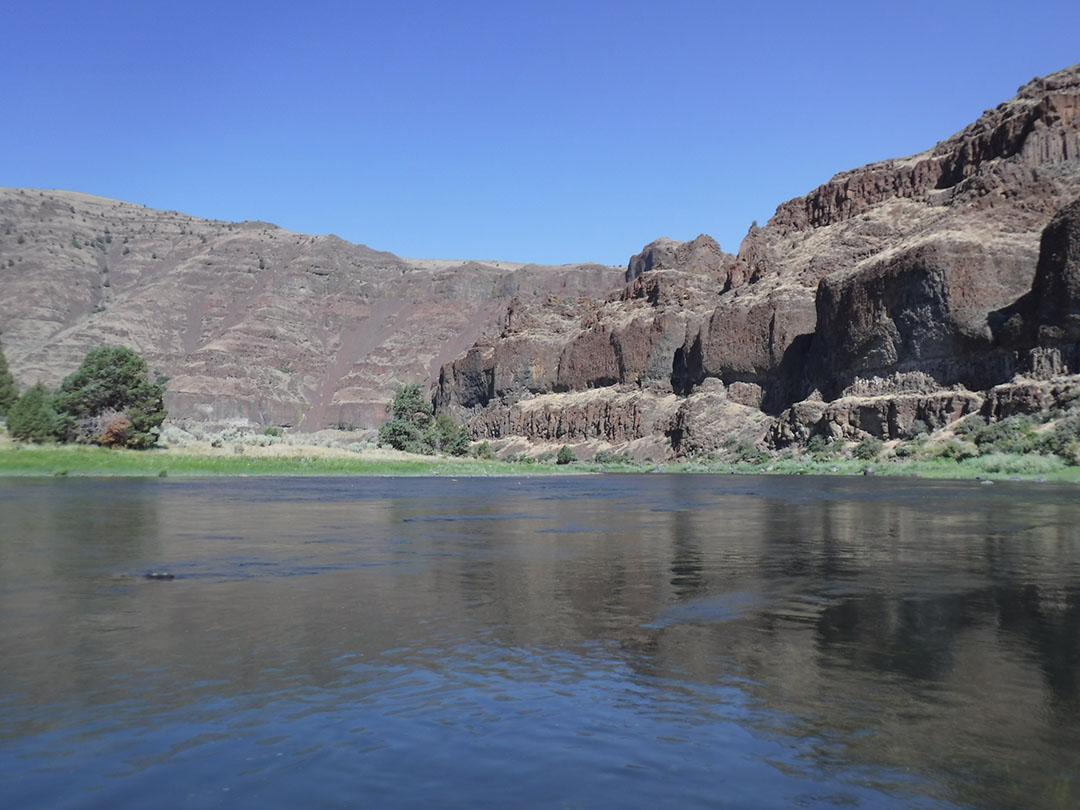
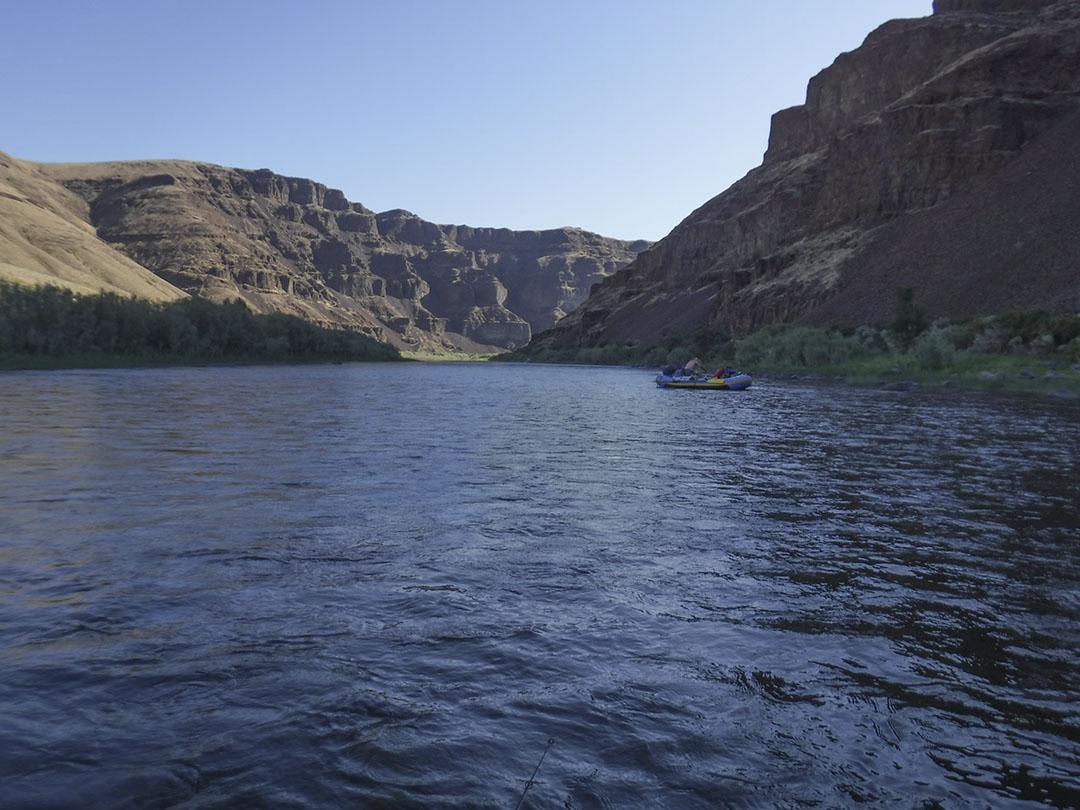
You have to get permits to float the John Day, which is both an Oregon scenic river and a National Wild and Scenic river, though there is no limit (so far) on the number of people floating it.  We got the permits, and the Ohio boys drove out and met me at our Montana house.  The next morning we piled all my stuff, including the folded up Water Master, in their big Dodge truck along with all their stuff, and drove the 10 hours to Arlington OR, where we spent the night.  The next morning we drove to Fossil, dropped off a set of keys with the guy who would shuttle our vehicle the 70 miles from put-in to take-out, and headed for the river at Clarno.  Our first view was both promising and worrisome--the riffle near the bridge didn't look very big, but there were small smallmouth swimming all around the sandy ramp to the water as we unloaded, inflated the rafts, and loaded all the gear.  After more than an hour in 90 degree sunshine, we started down the river, through that first riffle where we at least never touched bottom, and we were committed to 70 miles and 6-7 days of wild river.DSCF8074.jpg


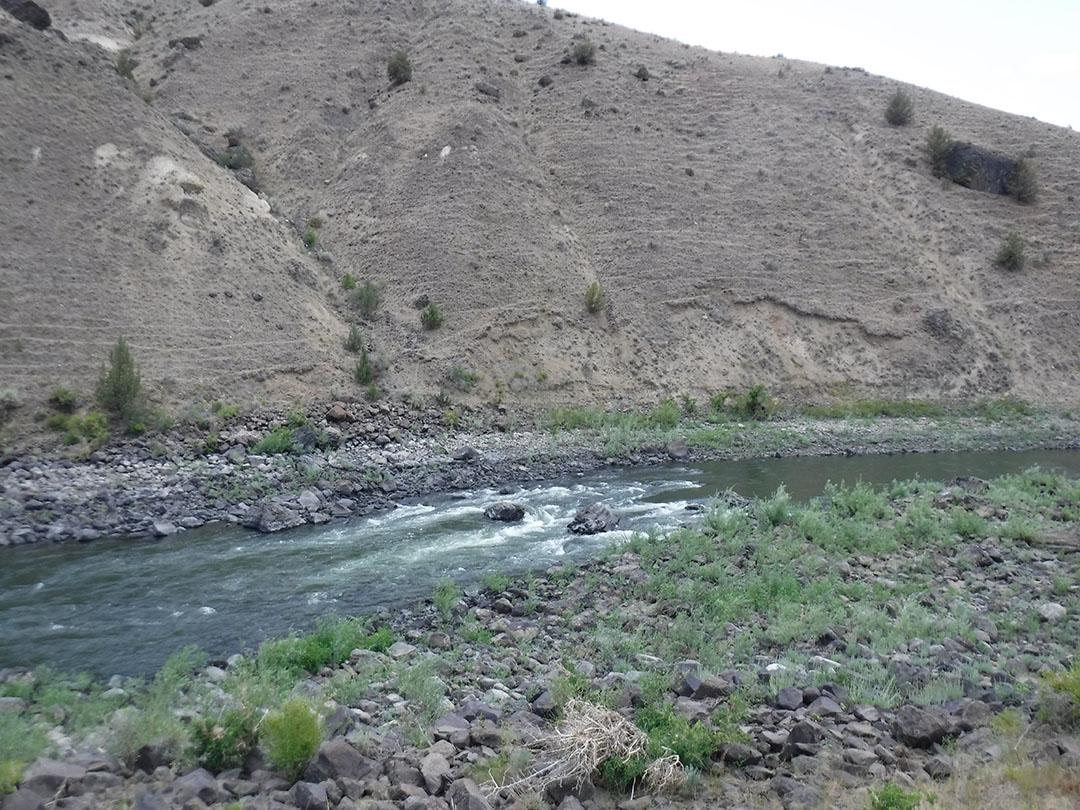
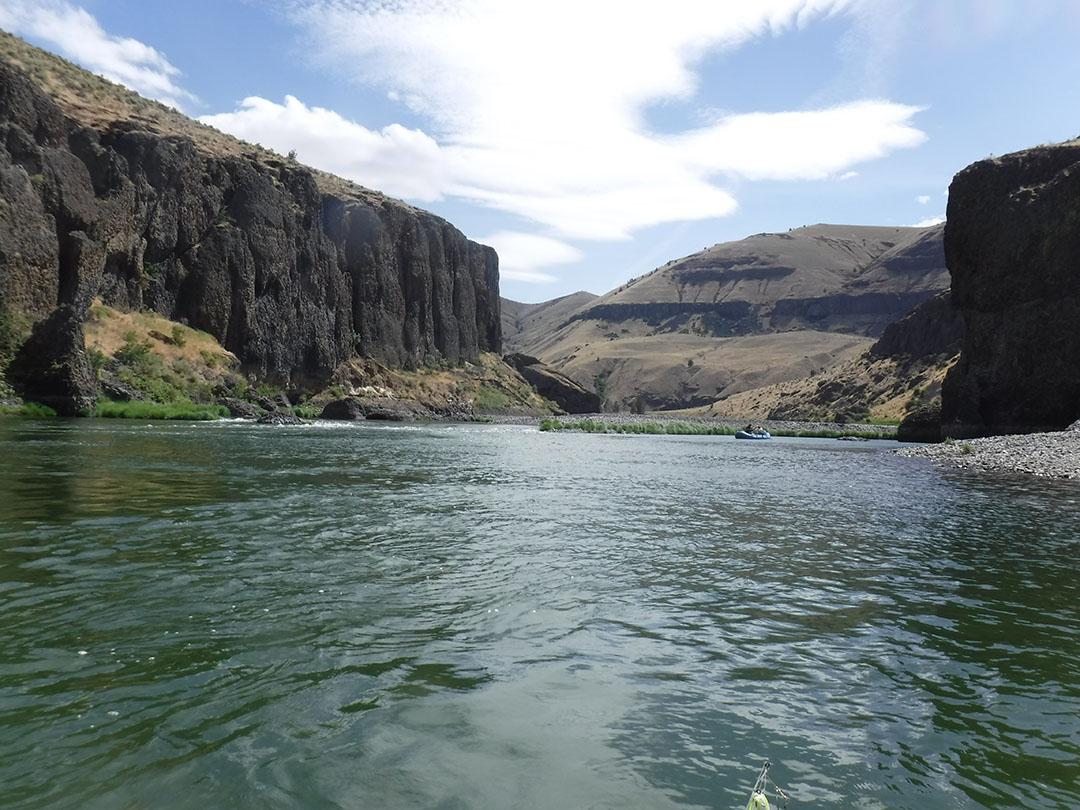
We were so worried about Clarno Rapid, 5 miles downstream, that we didn't even rig fishing rods, we just steadily rowed.  The riffles were easy at first, but a mile above Clarno Rapids we encountered the first thing I was worried about, shallow riffles over a mostly solid basalt bottom.  I'd been worried mainly that the basalt would be sharp and might damage the rafts, but we slid over the shallows with relative ease.

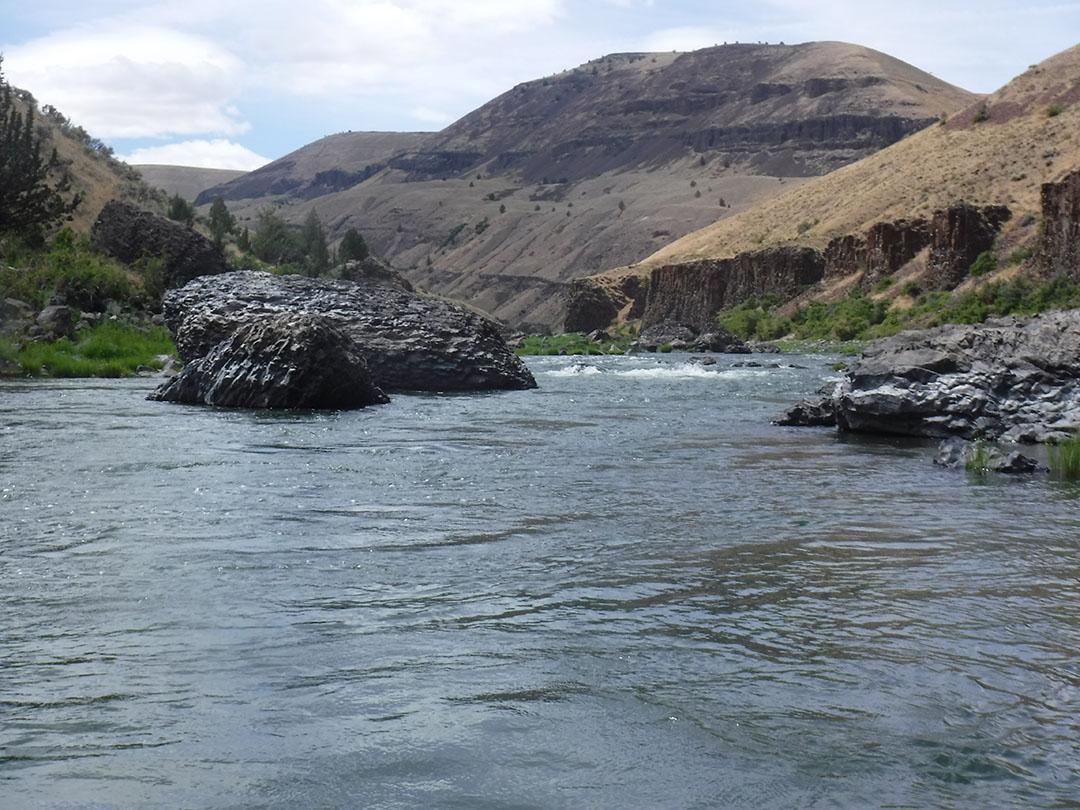
Clarno is actually two rapids, an upper and a lower.  We finally came to Upper Clarno.  We got out to scout it, and it had an impressive three or four foot drop through big boulders, but looked easily doable in the center gap.  DSCF8076.jpg

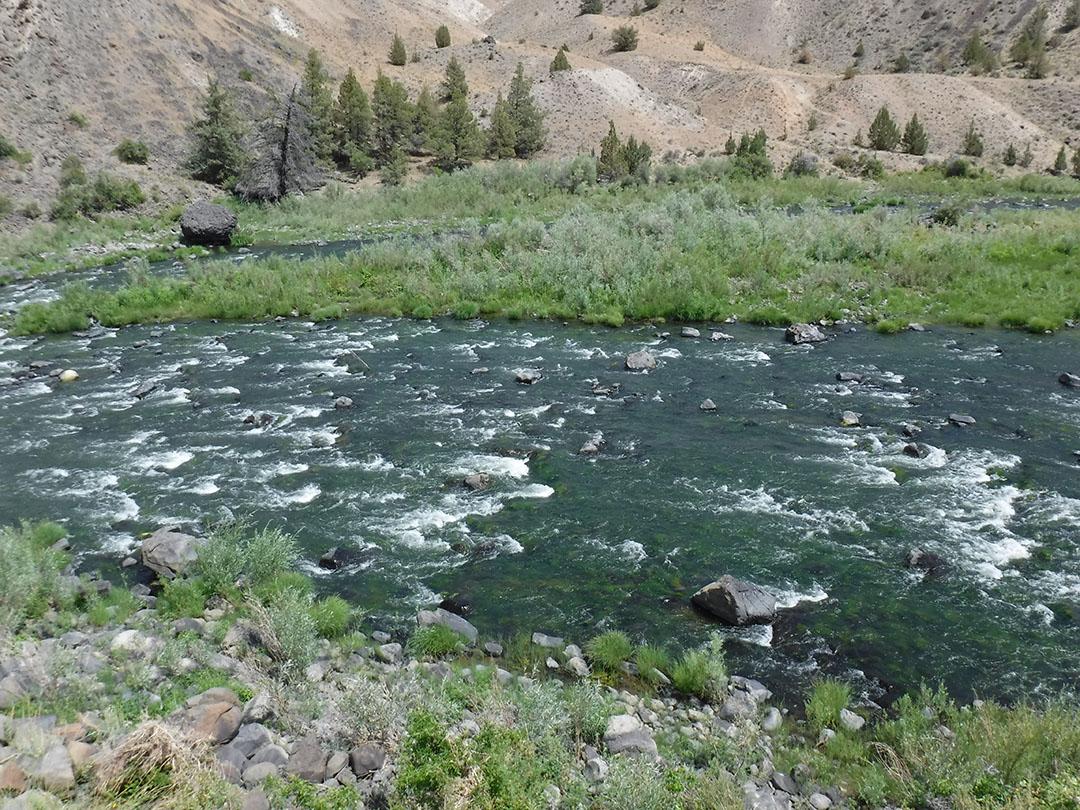
No problem.  I ran it easily even in the little Water Master.  Then, a quarter mile downstream, the river split at a rocky island, with most of the water going over a shallow rock riffle with about two feet of drop...and then we were at the head of Lower Clarno.  We climbed up the hill to scan it, and it didn't look good.  It was a boiling obstacle course.DSCF8079.jpg

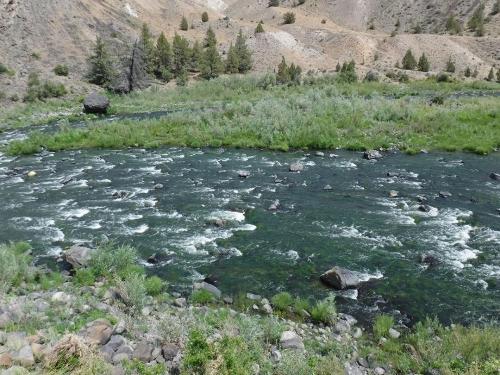
Which went a long way before funneling down a bit to the last big drop, about three feet through the jagged teeth of a row of huge boulders.DSCF8078.jpg

Viewed from below, you could see that final drop, with the only option the gap on far river left, which is to the right in this photo.  DSCF8082.jpg

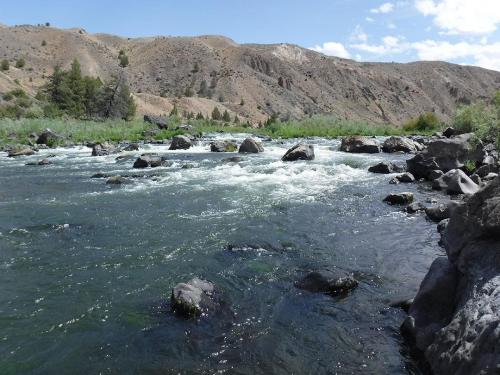
The problem with that option was the huge boulders guarding it just upstream, which you had to slide behind to line up for that drop.  And then there were two barely submerged boulders just 10 feet above the drop, and there was really no way to avoid both...you'd have to slide over one of them.  And finally there were other boulders barely underwater just below the drop.  But there was nothing to do but run it.  I took off first, finding it surprisingly easy to negotiate the obstacle course of the rapid until I neared that drop.  I slid into position, and saw I could hit the gap easily, but the roiling, boulder strewn water at the bottom of the drop looked even scarier from river level.  I'm sorry to say I chickened out.  I eased over to the bank and the other guys, who were there watching, helped me slide the loaded Water Master over the rocks behind the big boulder on the edge of the bank.  Then I ran the last bit of froth below.

The other guys all have a lot of whitewater experience, but Ken wasn't feeling well.  John was next, and he made it down the rock garden, slid into the gap perfectly, over the submerged guard rocks, though the gap barely wider than his raft, and rode out the waves below.  Ken then asked him to take the other raft down.  He did, even better.  We were past Clarno!

It was mid-afternoon when we made it through the Clarno Rapids, and we still had 4 miles to go to the first campsite.  The "gravel" bars on the John Day are rock bars, not conducive to camping on, so there are more or less designated campsites, mainly spots on the banks a bit above gravel bar level where there is flat ground and a few juniper trees for shade.  Most are marked on the guidebooks we had, and I'd also marked them on my complete set of topo maps for this stretch of river.

But after making it through the one spot that really worried us, we just had to rig up the rods and start fishing.  It was also nice that the wind hadn't risen.  Almost every day I'd ever been on the river, the wind had come up sometime during the day, and it invariably blew upstream, making fishing much more difficult.

The John Day pretty much has one predator fish during the warm weather months--smallmouth.  Smallies were stocked in the river many years ago, and if you were drawing up the perfect smallmouth river, you wouldn't have to use your imagination, you'd just copy the John Day.  It's a riffle/pool river, the riffles fast and dropping sharply to provide more oxygen during hot weather when the river's temperatures reach the upper 70s and lower 80s, the pools long stretches of gentle current swirling around boulders of all sizes, anywhere from a foot deep to too deep to see the bottom.  The water visibility was about 4 feet with a beautiful green color.  Crayfish live in the John Day, and lots of aquatic insects, as well as juvenile fallfish, the adults of which look like giant creek chubs.  The state of Oregon used to value the smallmouth fishery to the extent of at least putting on a 10 fish limit, but in recent years they've decided the smallmouth are bad for the baby steelhead and salmon that hatch out in the river in the late autumn and early spring, so they have removed all limits on smallies; you can keep as many as you care to clean.  I had been uneasy about that, fearing that the removal of the limits would hurt the smallmouth fishing.  So I was anxious to start casting to find out.

First cast with a spinnerbait...strike, miss, strike, miss, strike, miss...and as the lure neared the Water Master I saw a wolf pack of at least a half dozen 6-7 inch smallmouth following it, swiping at it, which is what I'd been feeling.  And that, my friends, would be how the whole trip went.  There are literally MILLIONS of smallmouth in the John Day.  They were everywhere.  Cast into shallow water, and you'd get a strike.  Cast into the middle of the deep pools and you'd get a strike.  Cast along the gravel bars, on in pockets in the rapids.  It didn't matter.  The problem is, nearly all those fish are less than 12 inches.  At one point, in mediocre water, I counted how many casts out of 200 that I made that DIDN'T get at least one fish swiping at the spinnerbait.  Only 37.  And of those, most had one of those packs of little ones following it.  If you just didn't cast randomly and picked a little bit better spots to make your casts, I have no doubt that you'd get a strike on every cast.

There seemed to be five year classes represented in those fish.  There were inch long fry in the shallows, young of this year.  There were four inchers cruising all through the shallower water, one year old fish.  Then those 6-7 inchers, which would swarm the lure and seemed to be just solid masses along the banks.  Then 9-10 inchers that actually got hooked constantly, also along the banks but also everywhere else, including cruising the middle of the river.  And finally, a whole lot of 11-12 inchers, and they were strong fish, strong enough that you'd think when you hooked one that it must be a pretty good fish.  But fish larger than that were scarce.  That first afternoon, I believe I caught maybe a half dozen fish between 13 and 15 inches.  The other guys, using various lures, had similar experiences, with Ken reporting he'd caught a single 16 incher.  In that four mile stretch, however, I ended up catching 67 smallies, Ken said he had 50 plus, and the other two guys had in the 40s.  They were mainly using curly tail grubs on jig heads.  I tried a lot of stuff, including topwaters, my homemade crankbait, and several spinnerbaits, and it didn't matter what I threw, the results were the same.  At first I thought that surely all you'd have to do was keep casting to the better looking spots and you'd catch some bigger fish among all the little ones, but it just didn't seem to be happening.

We found the campsite about 7 PM, plenty of time to set up tents and cook some supper.  My responsibility for the trip had been to provide supper.  We had a big freeze dryer, and Mary had cooked up meals for us all and freeze-dried them, so all I needed to do was boil water to reconstitute them, dump them in a big pot, and pour enough water to make them the proper consistency.  This first night we had chili.

There were no insects, and the weather was delightfully cool as the sun went down, so we could have slept under the stars, but we all opted to put up our tents without the rain flies.DSCF8092.jpg

The next morning we got a fairly early start after a quick breakfast, anxious to start fishing.  Surely we'd catch some bigger fish this day.  And it started out well for Ken, who quickly caught a 17.5 incher.  But then it was back to the little ones.

The river had started out in a fairly shallow, wide canyon:DSCF8083.jpg

But it was gradually digging deeper into the landscape.  There were many steep, sharp dropping little rapids that made for interesting maneuvers to avoid the rocks:DSCF8088.jpg

And it was beginning to show the basalt cliffs for which the John Day is famous:DSCF8084.jpg

As it carved ever-deeper into the high desert plateau:DSCF8089.jpg

We passed the mouth of Butte Creek, which is the spot where I'd always put in on the guided trips, and we knew that Basalt Rapid, the only other rated rapid on this stretch, would be coming up soon.  I remembered Basalt from the other trips as a sharp but open drop with much of the water crashing against a couple huge boulders just below, not particularly difficult to run.  It's rated class 3, but that's in higher water levels.  It wasn't much of a problem at this level:DSCF8086.jpg


There were other "riffles" that actually were more of a problem.  Often the river would shallow out over a very wide flat approaching the riffle, and then most of the water would funnel into a very narrow trough as it curved along a bank, with big boulders strewn throughout the trough that required a lot of quick maneuvers.  I had no problem with the Water Master; it was made for this kind of water.  But the bigger rafts were more difficult to negotiate those very fast and narrow gaps.  Still, the guys knew what they were doing and we had no mishaps.  And so the days went.  We passed Thirtymile Creek, where some outfitters put in these days for 42 more miles to the take-out.  Both Butte Creek and Thirtymile Creek require 25 to 30 miles of rough dirt road, almost 4WD territory, to get to the river, and they aren't much fun.  After Thirtymile Creek, where there is a single cabin close to the river, there would no more signs of civilization whatsoever for the next 40 miles.DSCF8093.jpgDSCF8095.jpgDSCF8105.jpg

John and I had been eyeing the occasional places where you could climb to at least the lower "rim" of the canyon; there was also a higher rim, and some of the bluffs on the outside of bends went all the way up to that higher rim, more than 1800 feet above the river.  So one night we were camped at a spot where we could climb a steep, grassy, rocky canyon-side, and we decided to do it:

DSCF8098.jpgDSCF8101.jpgDSCF8103.jpg

You can see the tents as the tiny white dots close to the river in the first picture.  We reached the lower rim, almost a thousand feet above the river, where the views of the John Day winding down its canyon were spectacular.

The fishing?  Well, it stayed the same. We tried everything we could think of to catch fewer little ones and maybe more bigger ones.  On the third day, Ken had found one big fish, a beautiful 19.5 incher, and had hooked and lost another that was at least that big, so we knew there were a few in there.  But we just couldn't figure out how to catch them...mainly, how to keep the little ones off so the bigger fish could get to our lures.  We tried the biggest lures we had, and caught little ones.  We tried fishing only the deeper water and caught little ones.  Nothing seemed to work.  But, on the other hand, it's difficult to complain too much when you're catching 200 or more fish per day.  And sometimes the scenery just overwhelmed us and we forgot about fishing for a while:DSCF8117.jpgDSCF8109.jpgDSCF8110.jpgDSCF8116.jpg

On the fifth day, I was drifting along a sheer basalt cliff, water who knows how deep, desultorily throwing a spinnerbait, when it just stopped dead.  I set the hook, and shouted "Finally!"  The others watched me fight the fish and finally lift it in triumph, a heavy 20 inch smallmouth!DSCF8114.jpg

A half mile downstream I caught a 17 incher, and then a 16 incher.  Were we finally going to get into bigger fish?  Nope.  That was it for the big fish.

We had planned the trip for seven days, but the wind had other plans.  Some days the wind would come up early, and we'd struggle to row against it and make the miles.  Other days it would stay mostly calm, and we'd just keep drifting and fishing, hoping to get ahead of schedule in case the wind came up.  And somehow on the fifth night we found ourselves only 12 miles above the bridge at Cottonwood Canyon.  We had had terrific fishing, spectacular scenery, fun rapids.  We'd seen bighorn sheep, golden eagles, and mule deer.  But we'd also gone five days without a cold drink.  We'd fought the wind; one night it had been cold, down into the 40s, with a hard north wind much of the night, but mostly the nights had been comfortable; yet we were getting a little tired of sleeping on the ground.  Our shuttler had said he'd take the vehicle down to the take-out the afternoon of the sixth day just in case we wanted to take out early.  So we decided that night would be our last.

Two miles above the take-out, we encountered the first signs of humanity we'd seen in 42 miles, a big power line and a couple of windmills atop the plateau that were visible from the river:DSCF8117.jpg

And a mile above the bridge, we came upon an actual human, a guy fishing from a little pontoon boat who had come up from the access.  And then we were pulling into the sandy ramp beneath the bridge, deflating the rafts, and piling everything into the truck with visions of cold drinks in our heads.  All in all it was a great trip, and we had to wonder whether in three or four years those five terrific year classes we'd been catching would be far bigger.  We were already making plans to come back then.  

We're all old farts.  I'll be nearly 70 in three years, the others close to the same.  But we did it this time, and maybe we'll do it again.